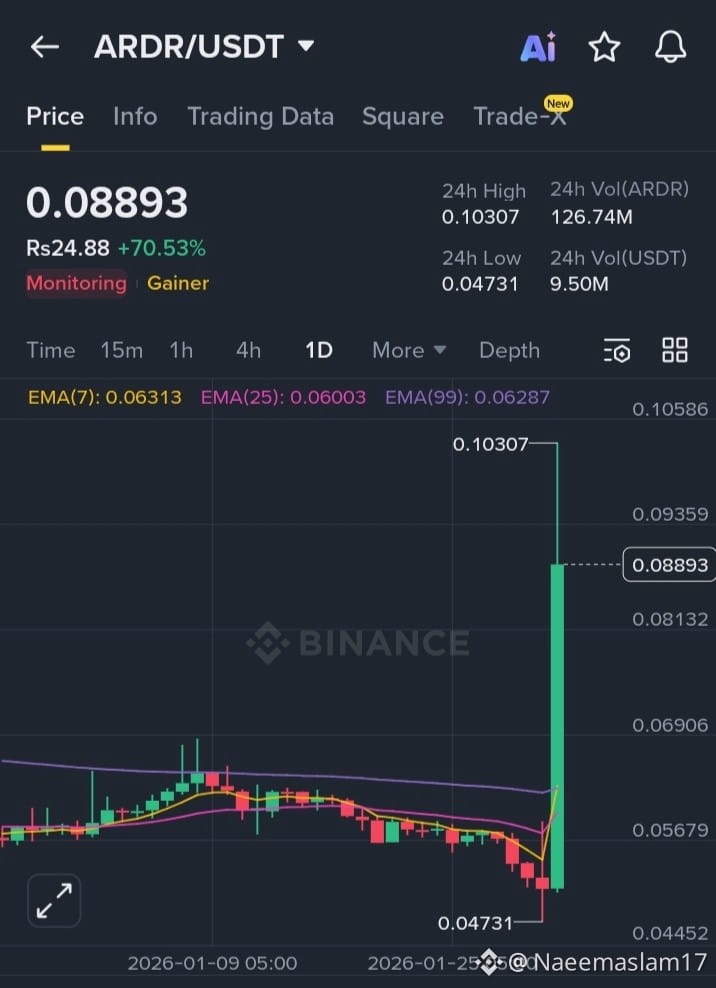
$ARDR has delivered a massive breakout today, gaining over +70% in a single session. This move was not random — it was a combination of technical structure, liquidity sweep, and momentum ignition.
Let’s break it down 👇
📉 1. Long Accumulation → Liquidity Grab
ARDR was trading in a compressed range for weeks.
Price dipped to 0.0473, which acted as a liquidity sweep / stop-hunt zone.
Weak hands were flushed out before the real move.
📌 Classic smart-money accumulation pattern.
🔥 2. Strong EMA Reclaim (Trend Shift)
On the Daily timeframe:
Price reclaimed EMA 7, EMA 25 & EMA 99 decisively.
This signals a trend reversal from bearish → bullish.
EMA cluster now acting as strong dynamic support.
📌 Trend followers & bots instantly jump in after EMA reclaim.
📊 3. High Volume Expansion
The breakout candle came with explosive volume.
Volume confirms real buying interest, not a fake pump.
24H volume jumped sharply, validating the move.
📌 No volume = fake move. This one had volume.
🧠 4. Market Psychology + Momentum
Once ARDR crossed 0.06–0.065, it triggered:
Breakout traders
Momentum bots
Short-covering
This created a vertical price expansion toward 0.10+.
📌 FOMO phase activated.
🧮 5. Key Levels to Watch Now
Resistance Zones
0.093 – 0.095 (intraday supply)
0.103 – 0.106 (major resistance)
Support Zones
0.075 – 0.078 (healthy pullback zone)
0.065 – 0.068 (EMA & structure support)
📌 As long as price holds above EMA zone, trend remains bullish.
⚠️ Important Note (Risk Management)
After a 70%+ move, short-term pullbacks are normal.
Chasing green candles is risky.
Best entries come on pullbacks, not breakouts.
#WhenWillBTCRebound #PreciousMetalsTurbulence #MarketCorrection