Understanding chart patterns is crucial for predicting price movements in trading. Here’s a breakdown of the three main types of patterns: Reversal, Continuation, and Bilateral Patterns.
---
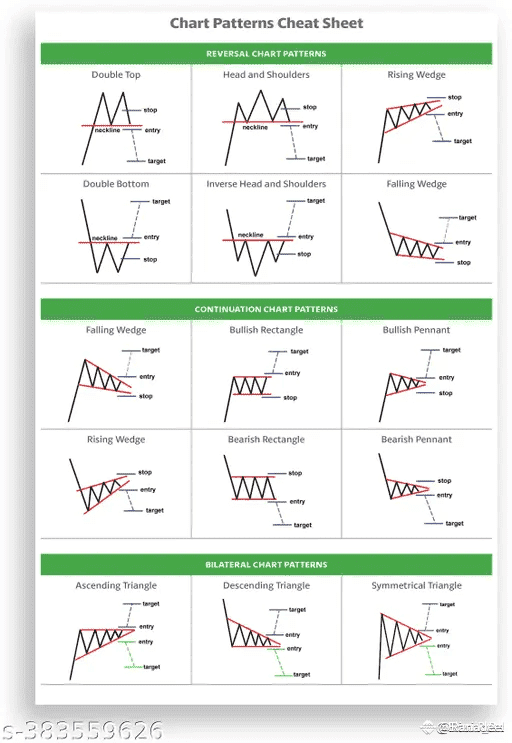
🔄 Reversal Patterns – Indicate a potential trend change
1️⃣ Double Top – Bearish pattern forming two peaks at the same resistance level before breaking downward.
2️⃣ Head & Shoulders – Bearish pattern with three peaks (left shoulder, head, right shoulder), confirming a trend reversal after breaking the neckline.
3️⃣ Rising Wedge – A narrowing upward channel that signals a bearish reversal when price breaks downward.
4️⃣ Double Bottom – Bullish pattern forming two troughs at the same support level before breaking higher.
5️⃣ Inverse Head & Shoulders – A bullish version of the Head & Shoulders pattern, signaling a trend reversal after breaking above the neckline.
6️⃣ Falling Wedge – A downward-sloping, narrowing pattern that leads to a bullish breakout.
---
🔄 Continuation Patterns – Suggest the current trend is likely to continue
1️⃣ Falling Wedge – A bullish continuation pattern where price consolidates within a downward channel before breaking higher.
2️⃣ Bullish Rectangle – Price moves sideways within a horizontal range before breaking upward.
3️⃣ Bullish Pennant – A small triangular formation after a strong uptrend, signaling further upside upon breakout.
4️⃣ Rising Wedge – A bearish continuation pattern where price consolidates in a narrowing upward channel before breaking downward.
5️⃣ Bearish Rectangle – Price consolidates within a horizontal range before breaking downward.
6️⃣ Bearish Pennant – A small symmetrical triangle forming after a strong downtrend, leading to a continuation lower.
---
🔀 Bilateral Patterns – Can lead to a breakout in either direction
1️⃣ Ascending Triangle – A pattern with horizontal resistance and rising lows, leading to a potential breakout in either direction.
2️⃣ Descending Triangle – Features horizontal support and declining highs, with breakout direction depending on market conditions.
3️⃣ Symmetrical Triangle – A neutral pattern with converging trendlines, signaling a breakout is imminent but direction is uncertain.
---
📌 Key Insights for Traders:
✅ Reversal Patterns indicate a shift in trend direction.
✅ Continuation Patterns signal that the trend is likely to persist.
✅ Bilateral Patterns suggest uncertainty, meaning price could break either way.
Learning these patterns will help you make better trade decisions, set entry points, stop-losses, and targets effectively! 💡💰
💬 Found this helpful? Like, share, and comment! Let’s grow together! 🚀🔥
Here is the picture below 👇