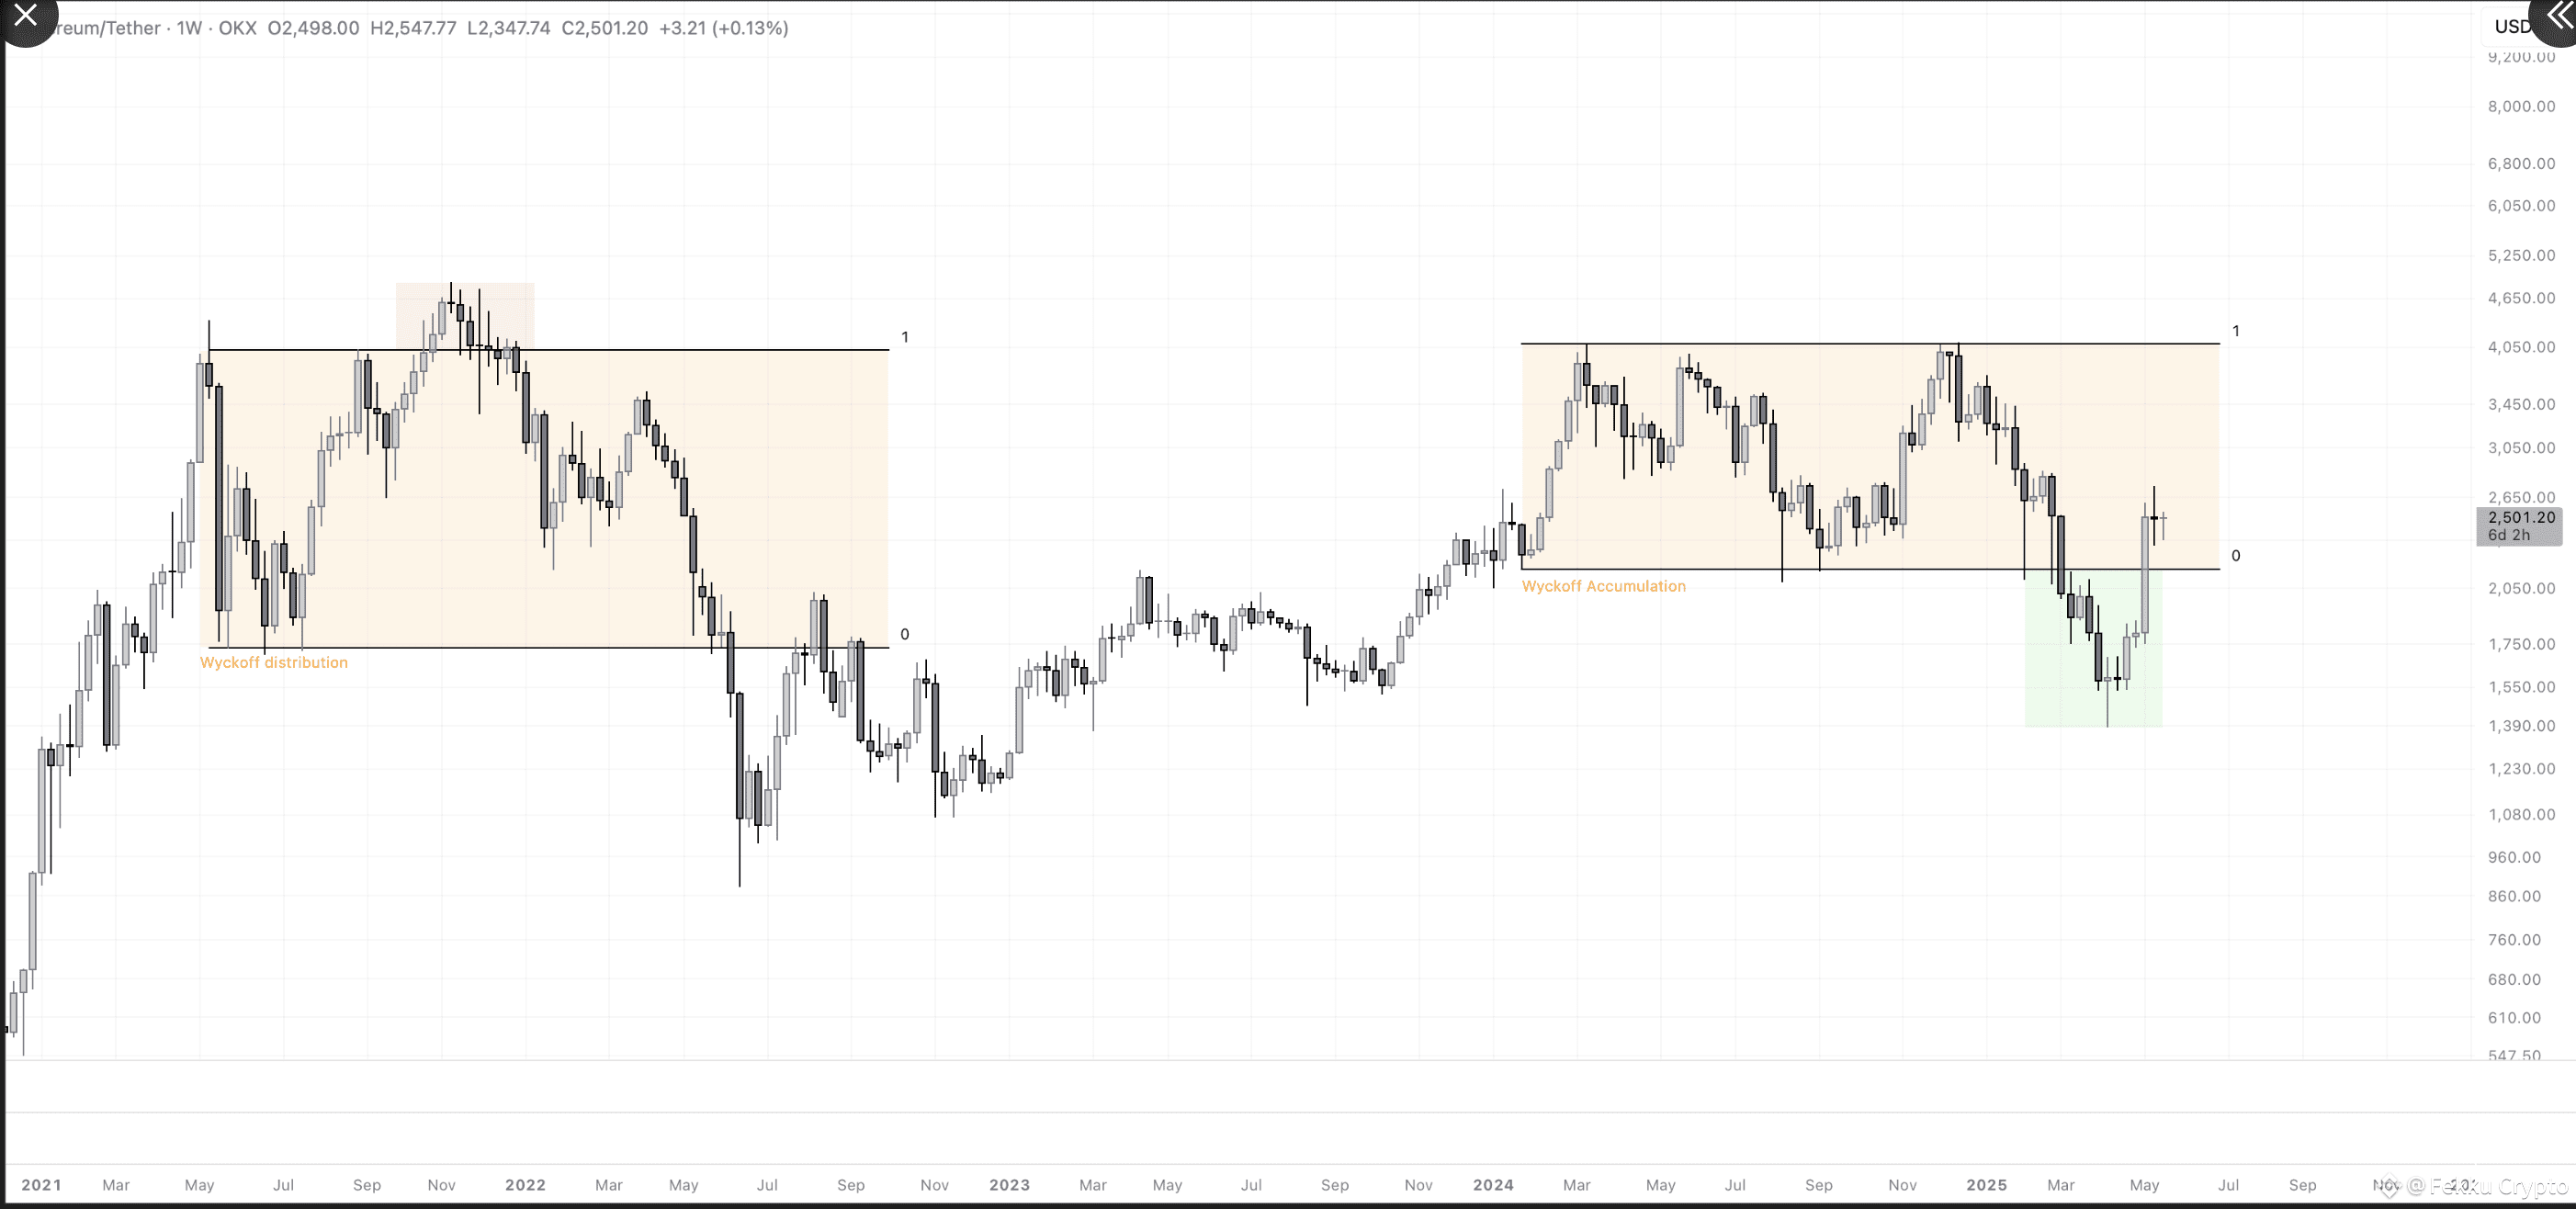
🔥 Ethereum Price Action: What the Chart is Telling Us 🔥
This chart shows two powerful patterns that traders love: Wyckoff Distribution and Wyckoff Accumulation.
📉 Left Side – Wyckoff Distribution (2021–2022)
Ethereum formed a top, moved sideways for months, then dropped hard. This is classic distribution—smart money selling while retail buyers got trapped.
📈 Right Side – Wyckoff Accumulation (2024–2025)
Recently, we’ve seen the opposite. After months of bouncing in a range, Ethereum dipped, shook out weak hands (green box), then came back strong—this is accumulation, a sign that smart money may be buying again.
Follow@Fekku Crypto for real time market insight and accurate alts coins signal set up.
Stay sharp!
#GENIUSAct #BinanceAlphaAlert #MyEOSTrade #BinanceAlpha$1.7MReward #SaylorBTCPurchase