Technical analysis chart for SOL/USDT:
 📈 Price with Support & Resistance
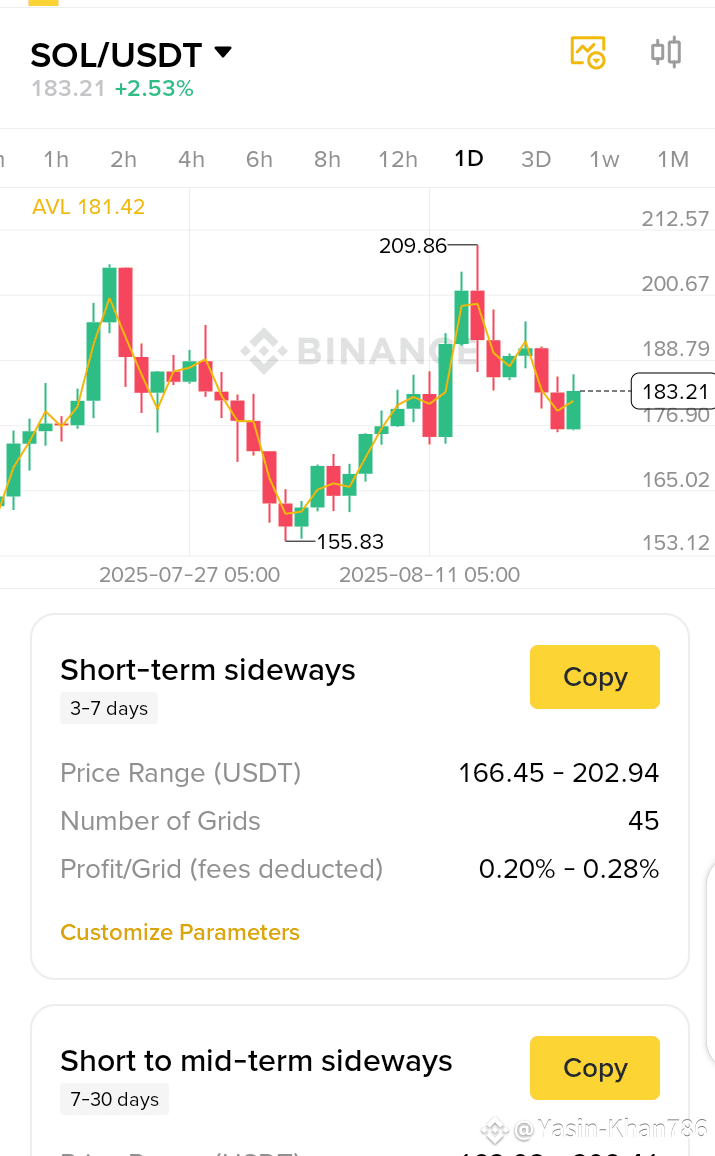
Current trading range: $166 (support) – $210 (resistance).
Price is consolidating near $183, close to the midline.
Short-term sideways, but holding above $180 is bullish.
🔎 RSI (Relative Strength Index)
RSI peaked above 80 (overbought) during the $209 rally.
Now it has cooled down to around 50, meaning neutral zone.
👉 No extreme buying/selling pressure → sideways or small recovery possible.
📊 MACD
MACD was strongly bullish but is now declining toward the signal line.
Momentum is slowing down, but not fully bearish yet.
👉 If MACD crosses below the signal, price may test $175–170.
✅ Summary
Short-term (next 3–7 days): Sideways between $175 – $195.
Bullish scenario: Break above $190 → target $200–210.
Bearish scenario: Drop below $176 → retest $166 support.
Indicators show neutral to mild bullish, but watch for Bitcoin’s trend (as SOL follows it).