👍 Let’s explain BTC/USDT chart in detail.
📊 Chart Explanation (BTC/USDT – Daily Timeframe)
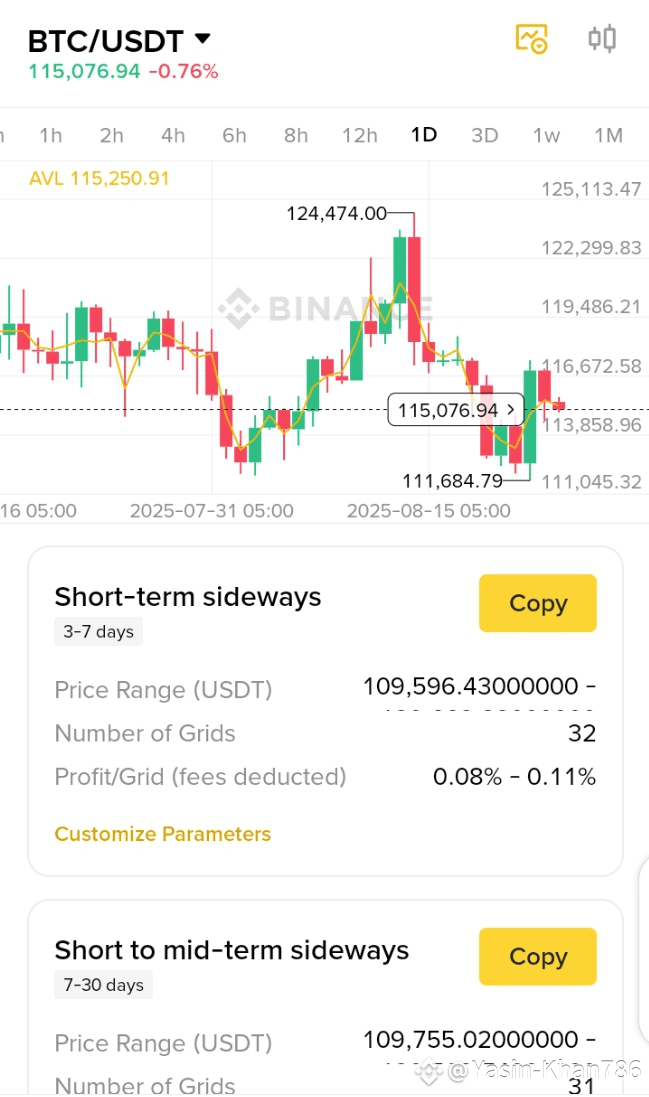
🔎 Key Levels on Chart:
Recent High: $124,474
Recent Low: $111,684
Current Price: $115,076 (down -0.76%)
Average Line (AVL): $115,250 (BTC is moving around this line, showing sideways consolidation).
Support Zone: $111,000 – $112,000
Resistance Zone: $116,500 – $117,000
The candlesticks show:
BTC recently made a big rally from $111k to $124k.
It failed to sustain above $124k and corrected sharply.
Now it’s consolidating between 111k – 117k.
📈 Market Sentiment:
Trend: Currently sideways/bearish bias after rejection from $124k.
Buyers are defending $111k level strongly (seen in the bounce).
Sellers are active near $116k–117k.
This means BTC is in a range-bound market.
🔮 BTC Forecast (Next 7–30 Days)
Bullish Case (Breakout Above $117k):
BTC can retest $120k–122k.
If momentum stays, possible move back toward $124k.
Bearish Case (Breakdown Below $111k):
BTC may drop to $109k–110k.
If heavy selling, deeper correction toward $106k–107k.
Most Likely Case (Sideways):
BTC trades between $111k–117k in coming weeks.
Good zone for grid trading/scalping.
⚡ Trading Strategy
For Traders (Short-term):
Buy near $111k–112k support.
Sell near $116k–117k resistance.
For Swing Traders (7–30 days):
Enter after breakout confirmation:
Above $117k → Long (target $120k–124k).
Below $111k → Short (target $106k–108k).
For Long-term Holders (Investors):
Current zone is an accumulation range.
Historically, such consolidations lead to a big breakout rally.
✅ Summary:
BTC is sideways between 111k–117k.
Short-term → sideways.
Breakout above 117k → bullish.
Breakdown below 111k → bearish.