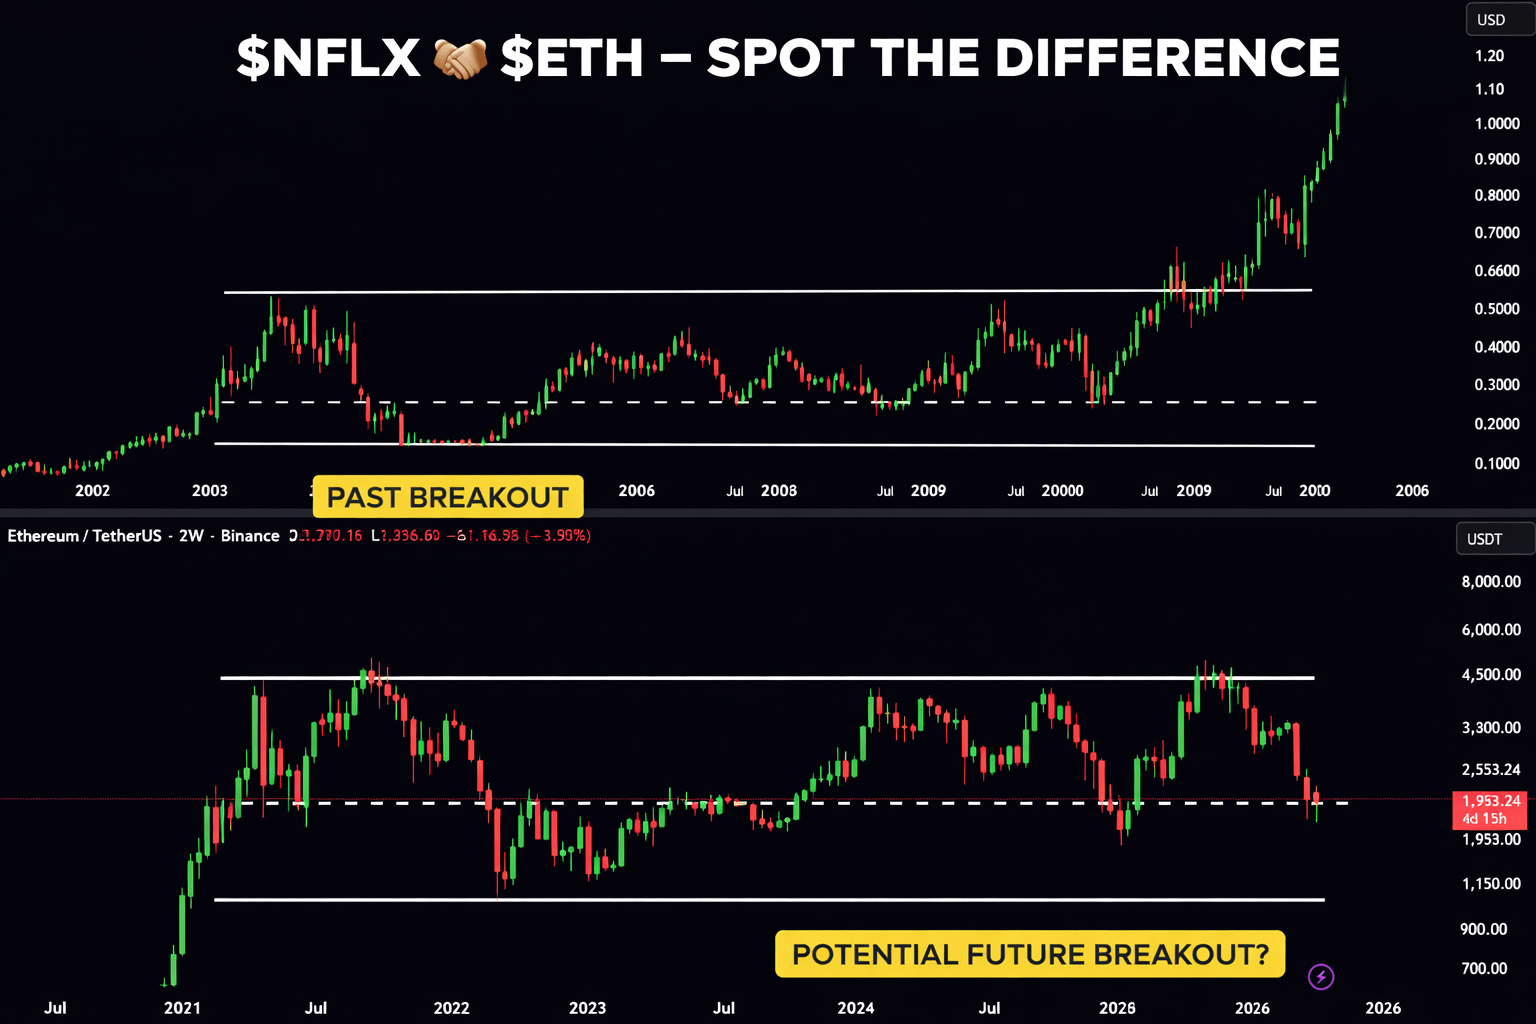
#NFLX 🤝 $ETH – Spot the Difference
Both charts show the same structure: a long period of range-bound accumulation between clear support and resistance. Price repeatedly tests the highs and lows, with several fake breakouts, while respecting the mid-range level.
In the NFLX chart, this phase ended with a clean breakout and a strong parabolic rally.
ETH is currently in a similar position, still inside the range but approaching a key decision point.
The difference:
NFLX shows the past breakout.
ETH shows a potential future breakout.