$ZRO (LayerZero) is showing a very clear bullish breakout on the daily timeframe. Price ripped higher from roughly 1.707 (the 24h low) up to around 2.483 (the level shown on the chart), which works out to an explosive ~+39.7% move in a single day. The surge also came with heavy participation, with roughly ~38M ZRO traded, which is exactly the kind of volume you want to see when a breakout is “real” and not just a thin-liquidity spike. In live pricing, #ZRO hovering around $2.45–$2.53 across major exchanges lines up with that same ~37–40% 24-hour expansion.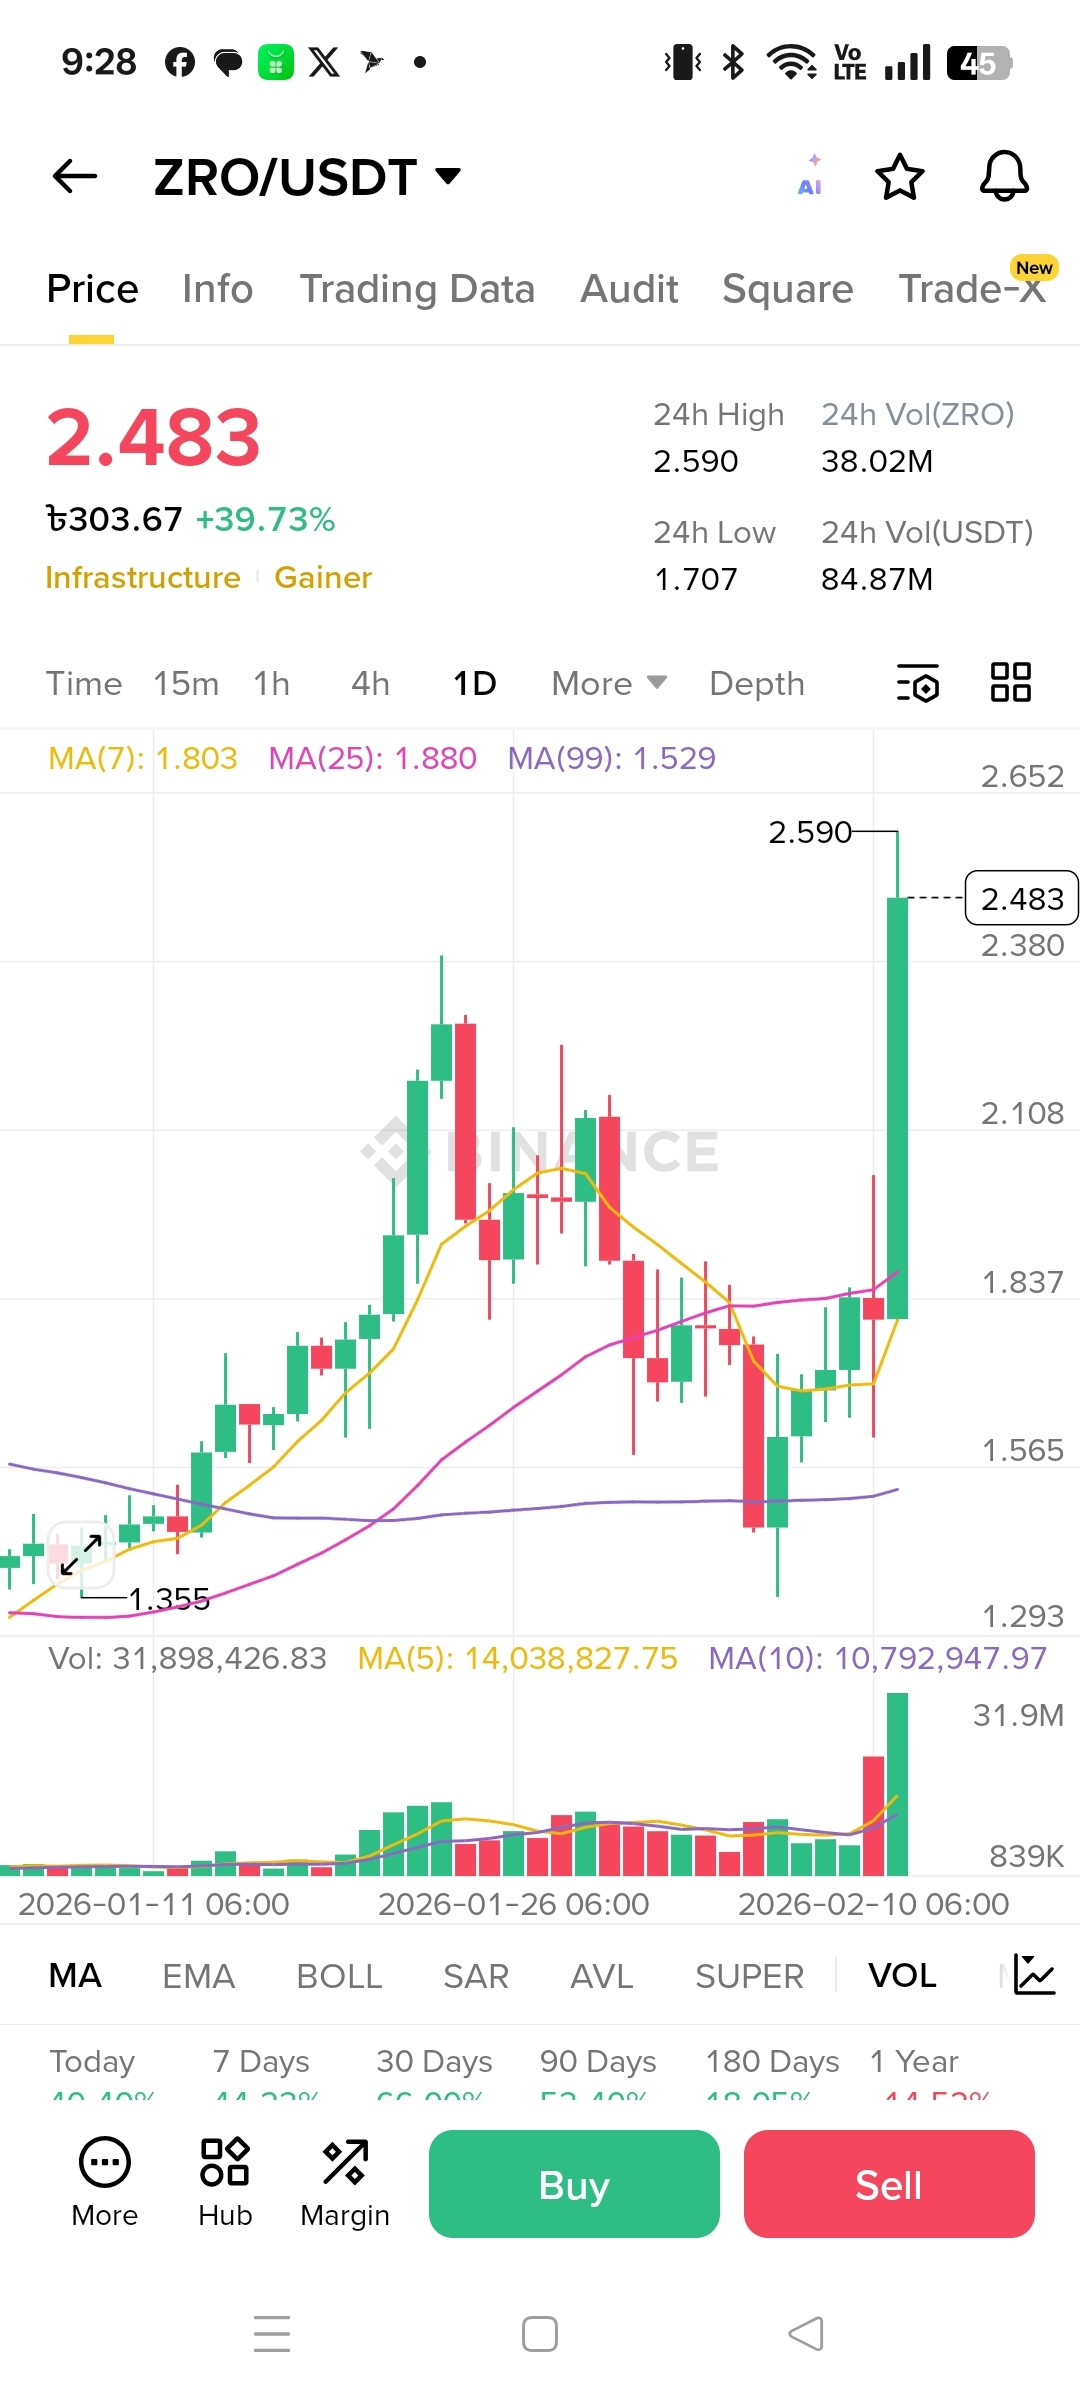
Technically, the breakout candle itself is doing most of the talking: a large green daily candle that pushed straight through prior resistance and closed well above recent ranges. That’s a classic momentum signature, especially when the market had been choppy and heavy earlier. The moving averages reinforce the same story—price is currently trading well above MA(7) ~1.803, MA(25) ~1.880, and MA(99) ~1.529, and with the shorter averages turning up aggressively, it’s the typical “trend is flipping and momentum is in control” setup. Even more important, the volume expanded dramatically versus recent sessions (with volume far above the recent volume MAs), which adds conviction and suggests this move has real demand behind it.
Structurally, it also makes sense: ZRO had been grinding lower and basing in the ~1.3–1.5 zone earlier, then suddenly printed a breakout candle that effectively swallowed the prior weakness, which often signals a stronger reversal impulse. From a trading perspective, the bias stays bullish for longs as long as the market holds above the breakout structure and doesn’t immediately give the move back. Momentum traders tend to remain active after candles like this, but it’s also normal to see profit-taking and sharp pullbacks after a +30–40% day, so planning entries and risk is everything.
For trade execution, an aggressive approach is to participate near current levels (~2.45–2.50) only if price continues to hold above the breakout base area (around ~2.38) and keeps printing higher lows. A more conservative plan is to let the market breathe and look for a retrace toward ~2.10–2.20 (near the opening zone of the breakout candle / deeper retrace area), or even into ~1.88–2.00 (around the MA25 region) for a cleaner risk-to-reward entry. On the upside, logical swing targets sit around ~2.65–2.80 first, then ~3.00–3.50 if momentum persists and the market accepts higher prices. In a stronger “trend reversal” scenario, a stretch continuation toward 4.00+ becomes possible, but that’s the kind of target you only lean into if price keeps building structure above prior supply zones rather than stalling out.
Stops should be placed where the breakout thesis is genuinely invalidated, not where it’s merely uncomfortable. A tighter invalidation is a loss of ~2.38 (if that level is acting as the new base), while a more structural stop is below ~2.10–2.20, because losing that zone often turns a breakout into a failed breakout. For traders sizing smaller and aiming for a longer hold, a wider stop under ~1.80–1.88 (near the moving-average/structure cluster) can make sense—but only with proper position sizing so the dollar risk stays controlled.
The main risk here is simple: after a vertical +40% candle, the market can snap back hard, and a rejection near the ~2.59 high could trigger a retest of lower support zones quickly. If ZRO fails to hold above the breakout base and volume fades, the move can compress into a pullback phase before any next leg up. So the cleanest way to trade this is to stay bullish while the structure is bullish, but manage risk tightly—keep position sizing disciplined and cap risk per trade (many traders use ~1–2% account risk) so volatility doesn’t force a bad decision.
