"this time it's different
is how we overthink a simple 4-year cycle and end up round-tripping every gains we made on our way up
don't overcomplicate things"
For $BTC , four years is more than just a measurement of time; it is the heartbeat of the entire market. While every cycle brings new narratives—institutional ETFs, nation-state adoption, or global liquidity shifts—the underlying rhythm has remained remarkably consistent since the Genesis block.
What is the Bitcoin 4-Year Cycle?
At its core, the 4-year cycle is driven by The Halving. This is a pre-programmed event in Bitcoin’s code that occurs every 210,000 blocks (roughly every four years). During a halving, the reward given to miners for securing the network is cut by 50%.
This creates a "supply shock." When the production of new Bitcoin drops while demand stays the same or increases, price action follows a predictable four-stage seasonal pattern:
1. The Accumulation (Spring): Prices stabilize after a brutal bear market. "Smart money" begins buying quietly while the general public is still fearful.
2. The Bull Run (Summer): The post-halving supply crunch kicks in. Bitcoin breaks its previous All-Time High (ATH), retail FOMO (Fear Of Missing Out) returns, and the price goes parabolic.
3. The Blow-off Top (Autumn): Euphoria reaches a peak. This is usually marked by mainstream media frenzy and "unrealistic" price targets. We are have passed here now.
4. The Crypto Winter (Winter): The bubble bursts. Prices drop sharply, and the market enters a prolonged correction, setting the stage for the next accumulation. We are currently here by my analysis.
Historical Performance: A Repeatable Script
Since its inception, Bitcoin has followed this script with surprising accuracy:
* 2012 Halving: Led to the 2013 peak of roughly $1,150.
* 2016 Halving: Fueled the legendary 2017 run to nearly $20,000.
* 2020 Halving: Propelled Bitcoin to $69,000 in late 2021.
* 2024 Halving: Set the stage for the climb toward our current cycle highs.
Why Analysts and Traders Use It
Top traders use the 4-year cycle because it provides a macro roadmap. Instead of getting lost in the "noise" of daily price swings, they use the cycle to determine when to be aggressive and when to be defensive. It helps them avoid the most common mistake in crypto: buying the top of the "Summer" and holding all the way through the "Winter."
The Reality of the Drawdowns
While the upside is exciting, the cycle is defined just as much by its "max pain" phases. Understanding the depth of previous crashes is the only way to keep your head when the trend reverses.
Historical cycle drawdowns for BTC:
* 2013-2015: -86%
* 2017-2018: -84%
* 2021-2022: -77%
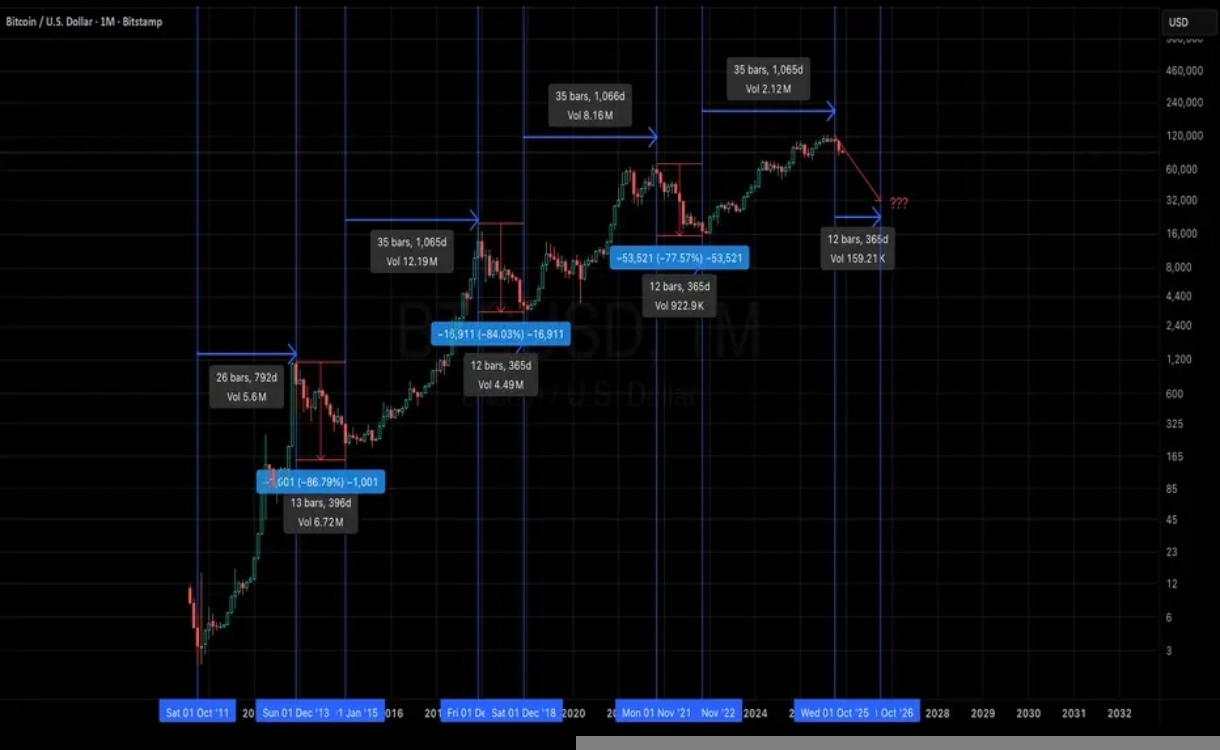
If we should translate that to a current cycle peak (ATH) of $126k:
* A 77% drop puts Bitcoin at $29k
* An 84% drop puts Bitcoin at $20k ish
No point finding out what an 86% drop could look like because what’s the point of the max pain?
Besides, I’m not expecting Bitcoin to drop below 77% this time because the drawdowns get less brutal each cycle as the market matures and institutional liquidity provides a stronger floor. So, a drawdown somewhere around 65-70% might be considered reasonable.
That is: $38k–$44k ish.