

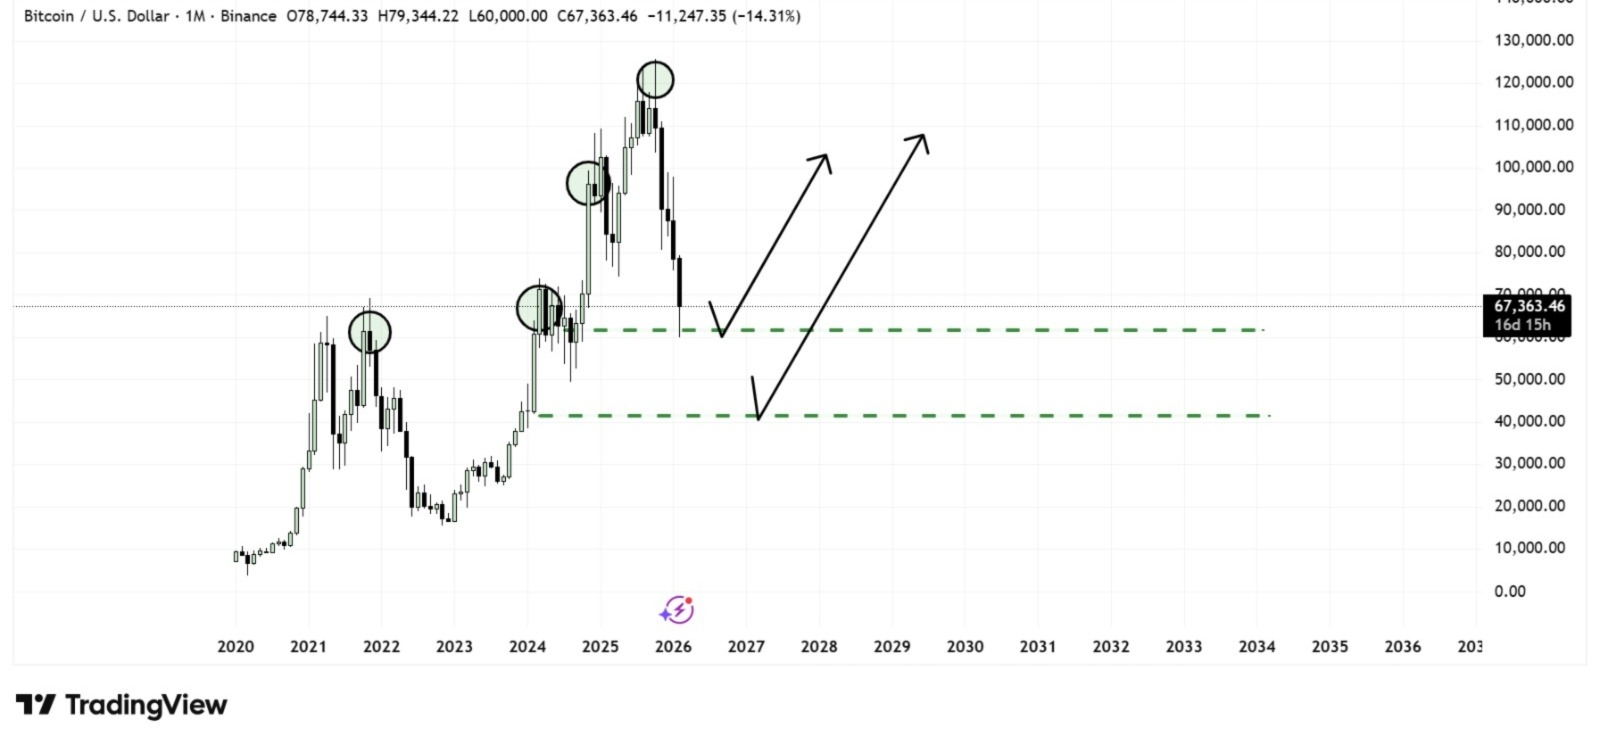
When we zoom out to the monthly timeframe, Bitcoin’s recent move looks less dramatic and more like a natural pullback within a broader bullish cycle. After reaching a major peak near the 110K–126K region, price has entered a corrective phase, which is common in long-term uptrends.
Structural Perspective
On the monthly chart, Bitcoin continues to respect the larger market structure. Historically, previous cycle highs often turn into strong support during the next phase of the trend. The 60K–70K region is particularly important because it aligns with prior consolidation, breakout zones, and heavy liquidity areas.
Monthly pullbacks of 30–40% are not unusual in bullish cycles. In fact, similar retracements occurred in past bull markets before continuation toward new highs. The key factor is whether price holds above major structural support.
Critical Levels
The 60K–65K zone is currently acting as a decision area. If Bitcoin maintains monthly closes above this region, it would signal that the broader bullish structure remains intact. In that case, the next macro targets could be 90K–100K, followed by a potential attempt at new all-time highs.
However, if price breaks below 60K with strong monthly bearish momentum, a deeper correction toward the 45K–50K range becomes possible. That zone would represent the next major historical support and likely attract long-term accumulation.
Market Psychology
From a psychological standpoint, monthly charts often filter out short-term noise. As panic on lower timeframes often looks like a normal retracement when viewed from a macro lens. Strong hands typically accumulate during these phases, while emotional participants exit positions.
Long-Term Outlook
As long as Bitcoin remains above major cycle support, the long-term trend cannot be considered broken. Corrections are part of market expansion cycles. The monthly structure still suggests that Bitcoin is in a higher-timeframe uptrend unless a decisive structural breakdown occurs.
Patience and discipline are critical on the monthly timeframe. The larger trend develops slowly, but when it moves, it defines the direction for months or even years.