Ethereum (ETH) is currently trading near $1,958 on the daily timeframe. Based on the chart structure, moving averages, and volume behavior, the market is still under pressure, but key decision levels are now very close.
1️⃣ Trend Structure (What the Chart Clearly Shows)
On the daily chart: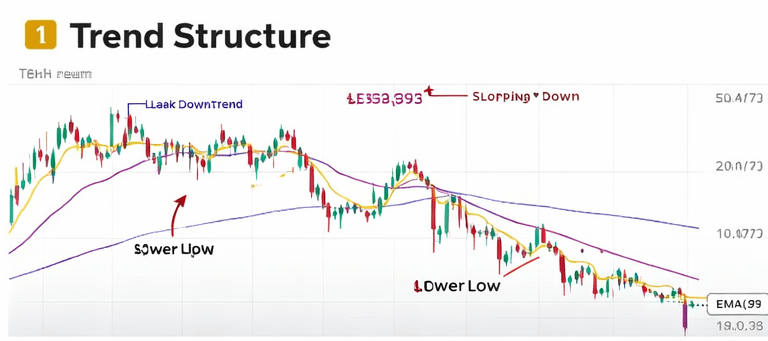

Price is forming lower highs and lower lows
After rejection near the $3,000 zone, ETH entered a strong corrective phase
A sharp drop pushed price toward $1,747, where buyers reacted
This confirms that ETH is still in a downtrend.
Until a higher high forms, the trend cannot be considered bullish.
2️⃣ EMA Analysis (7, 25, 99)
The chart includes three important EMAs: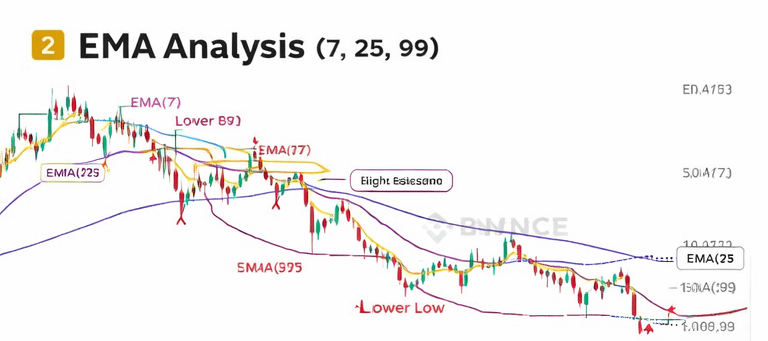
EMA 7 (short-term momentum) → Sloping downward
EMA 25 (mid-term trend) → Acting as dynamic resistance
EMA 99 (long-term trend) → Positioned well above price
Currently, price is trading below all three EMAs, which means:
Short-term pressure is bearish
Mid-term direction is bearish
Buyers have not regained control
For momentum shift, ETH must first break and close above the $2,100–$2,200 EMA resistance zone.
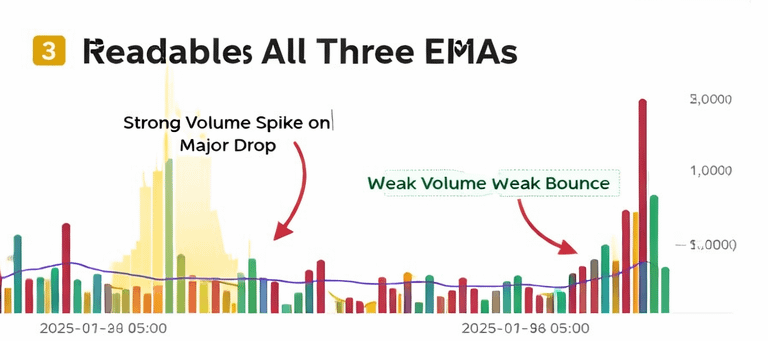
3️⃣ Volume Confirmation
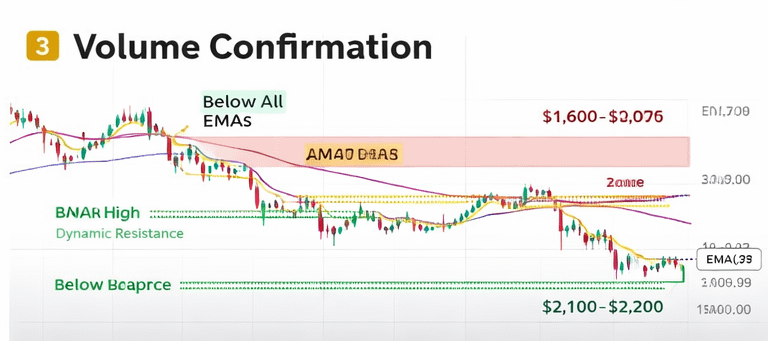
During the recent drop, the chart shows a strong volume spike, indicating aggressive selling.
However:
The bounce from $1,747 came with weaker volume
No strong accumulation pattern yet
This suggests the recovery is not fully confirmed.
4️⃣ Key Levels From the Chart
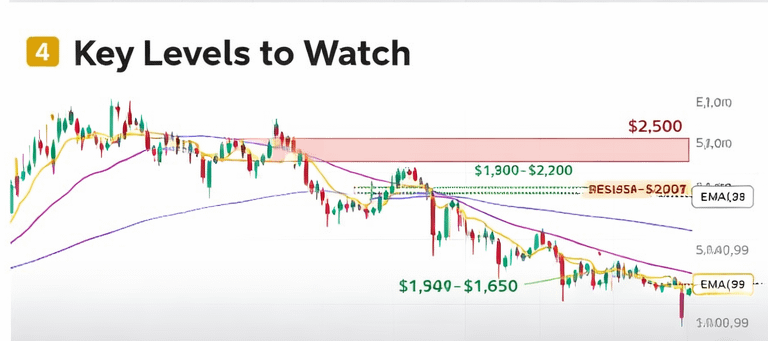
🟢 Strong Support:
$1,747 – Recent daily support level
If this breaks with volume, downside toward $1,600–$1,650 is possible.
🔴 Major Resistance:
$2,100–$2,200 – EMA cluster resistance
$2,500 – Previous structure breakdown zone
A daily close above $2,100 with strong volume could signal short-term bullish reversal.
5️⃣ Is There Profit Potential?
Short-Term:
No confirmed buy signal yet.
Breakout above resistance is required for safer entry.
Long-Term:
Ethereum fundamentals remain strong:
Smart contract dominance
Strong DeFi ecosystem
Long-term institutional interest
For investors, gradual accumulation may be safer than full entry.
Final Conclusion
The ETH daily chart shows a market still in correction.
Support at $1,747 is critical, while $2,100 is the key breakout level.
Until resistance is reclaimed with volume, the market remains technically bearish.
Smart traders will wait for confirmation rather than predicting direction.

#TechnicalAnalysis
#BinanceCommunity
#CryptoTrading
#SupportAndResistance
#VolumeAnalysis