In the past few years, the trends of $XRP have revolved more around court progress.
By 2026, the market's focus has shifted to a core issue - the actual trading volume versus real network usage.
In the past few weeks, I have been continuously tracking the liquidity bridging data of RLUSD on the XRP Ledger (XRPL). On-chain data is telling a story, and the current price does not seem to fully reflect this change.
1. Technical 'Compression Zone': Why is $1.40 so critical?
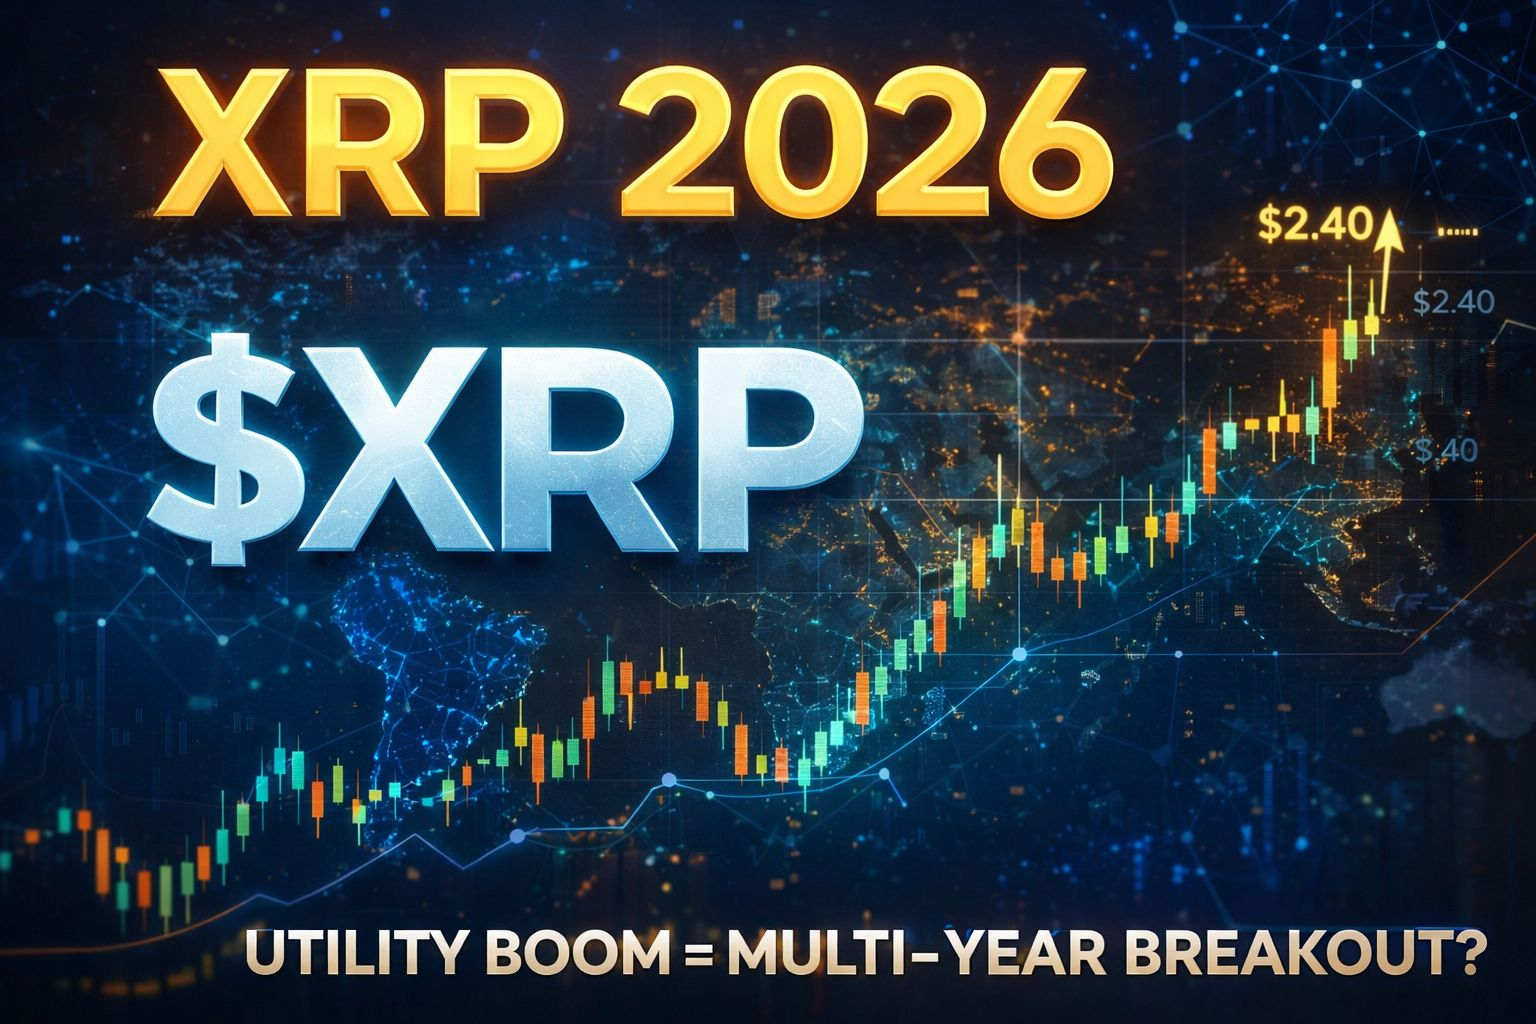
After peaking at $2.40 in January, XRP corrected about 40%, washing out a lot of late investors. From a structural perspective, this seems more like a healthy pullback confirmation rather than a trend ending.
Current prices hover around the support area of $1.43–$1.50, which has served as a launch platform multiple times over the past six months.
💡 My judgment:
When an asset enters a narrow range after a significant rise, it often indicates that momentum is building. Exchange balances have dropped to near seven-year lows, and the supply side is contracting. If it can maintain $1.40 this week amidst macro fluctuations, the next upward phase could be very rapid.
2. Real-world implementation: RLUSD liquidity bridge has been put into operation
What truly deserves attention is not social media hype, but actual application progress.
Ripple USD (RLUSD) has gradually entered the cross-border settlement system, especially in the Southeast Asia corridor. On-chain data shows that RLUSD currently accounts for about 15% of cross-border settlement flows in the region.
This means real use cases:
Every RLUSD settlement requires XRP to complete network processing and value transfer.
This is not emotion-driven trading volume, but rather functional demand related to financial infrastructure.
3. Market sentiment: from being overlooked to revaluation
Many holders have experienced the sideways movement of XRP while other cryptocurrencies have seen rapid increases. This 'patience' has shaped the cohesion of the XRP community.
Historical experience shows that low-key positioning by institutions often appears unremarkable until a true price revaluation occurs.
The narrative is shifting from the 'legal battle phase' to the 'institutional application phase.'
We are transitioning from the 'court era' to the 'board era.'
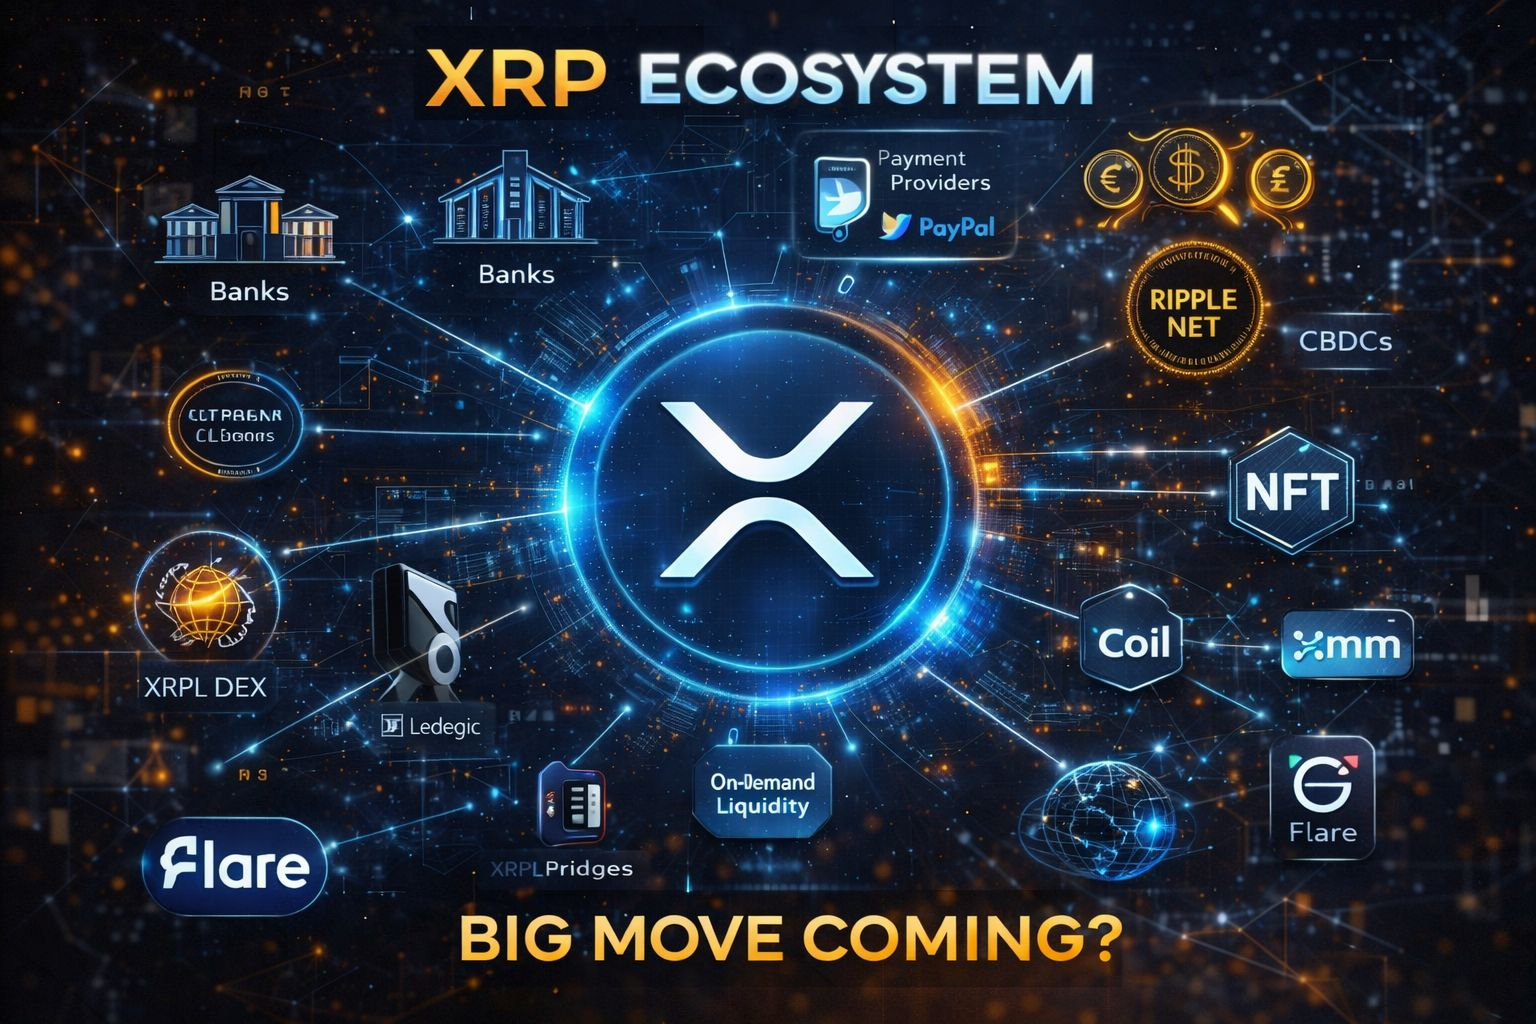
4. Simple understanding of how XRPL operates
You can imagine the XRP Ledger as a global digital highway.
Vehicles: Different currencies (USD, EUR, RLUSD, etc.)
Bridge/Passage mechanism: XRP
As more funds enter this highway, assets taking on the role of the bridge naturally become more important.
The greater the traffic flow, the higher the value of the bridge.
This is essentially a supply-demand relationship driven by network usage.
5. Price scenario outlook for 2026
💬 XRP market sentiment update
🔥 Bullish scenario:
If the daily price firmly holds above $1.65, along with increased ETF inflows, there is a chance for the price to challenge the range of $3.80–$4.50, forming a new trend momentum.
🤝 Neutral scenario:
Prices may fluctuate in the range of $1.40–$1.80. This range is suitable for dollar-cost averaging (DCA) and gradually building long-term positions.
⚠️ Bearish scenario:
If the overall market experiences a significant pullback, XRP may test the $0.95–$1.10 range. The $1.00 psychological level remains a critical observation point.
2026 Conclusion: Focus on the underlying architecture rather than market noise
The gap between application value and market pricing is narrowing.
Instead of waiting for sudden good news, it’s better to focus on on-chain data and the growth of real use cases.
If below $1.00 is the early positioning stage, then the current fluctuations around $1.40 may be the last relatively rational entry point of the year.
Are you scaling in near support levels, or waiting for a breakout above $2.00 to confirm the trend?
Welcome to share your 2026 target views
#CZAMAonBinanceSquare #USNFPBlowout #TrumpCanadaTariffsOverturned #USRetailSalesMissForecast #USTechFundFlows