Altcoin rotation has been quiet lately, with many large-cap tokens lagging behind Bitcoin. Binance Coin (BNB) is no exception. So far in 2026, BNB has retraced to levels last seen in Q2 2025 and the BNB/BTC ratio has declined about 7%, reflecting cautious market sentiment.
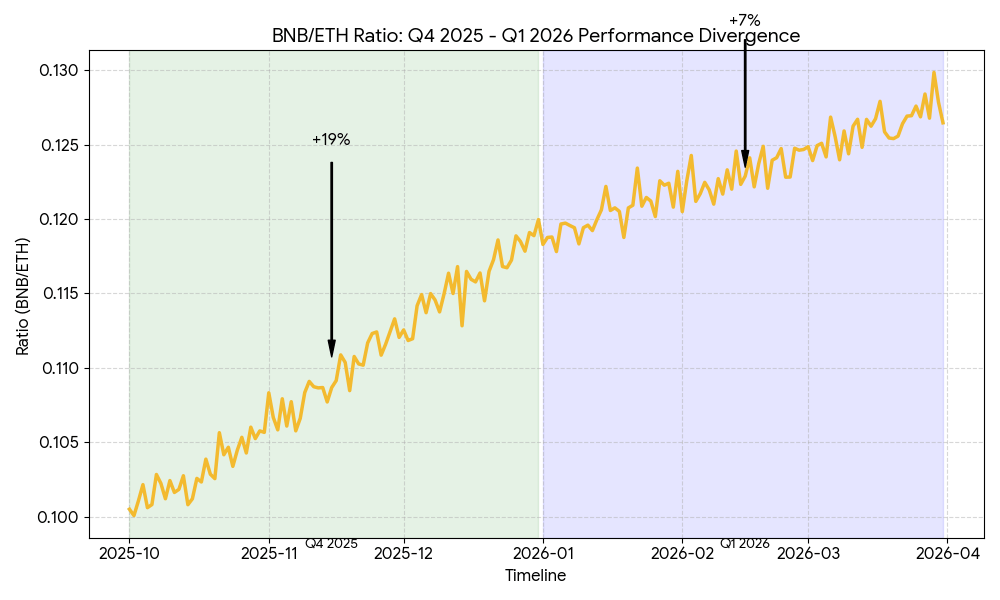
However, a closer look at BNB/ETH reveals an interesting dynamic. In Q4 2025, Ethereum (ETH) experienced deeper losses than BNB, which pushed the BNB/ETH ratio up 19% even in a broadly declining market. In Q1 2026, a similar pattern may be emerging: BNB/ETH is up roughly 7%, while ETH has fallen more relative to BNB. From a technical perspective, this highlights a divergence in performance between the two tokens.
On-Chain Activity and Fundamentals
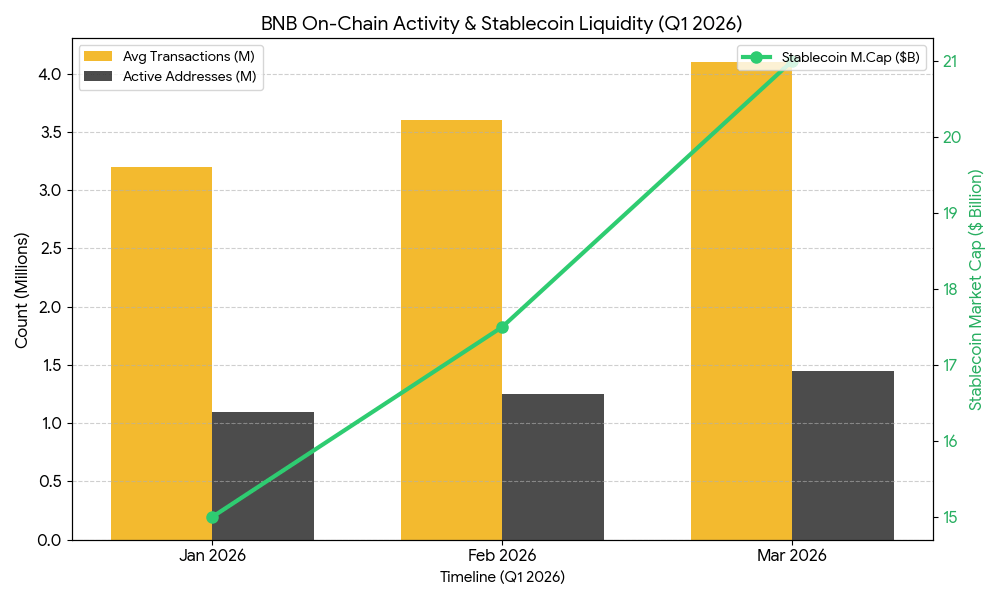
Data from Messari shows that BNB has demonstrated strong on-chain activity:
Average transactions increased 30.4% to 17.3 million in Q4 2025
Active addresses rose 13.3% to 2.6 million
Stablecoins have also supported liquidity on BNB. The stablecoin market cap on BSC grew 9.2% QoQ in Q4 2025, with USDT at $9B (+12.4%) and USDC at $1.3B (+23.1%). Real-world asset (RWA) value on BSC surged 228% QoQ to $2B, making it the second-largest RWA network after Ethereum.
Early data for Q1 2026 suggests this trend is continuing: BNB’s stablecoin market cap is up 2.5%, and its RWA value has grown 5% month-to-date to over $2.15B. These metrics suggest that on-chain activity is maintaining momentum, reflecting fundamentals rather than speculative moves alone.
Key Takeaways for Users
The rising BNB/ETH ratio indicates that capital flows may be favoring BNB relative to ETH in the current market. Observing on-chain metrics alongside price action can provide a clearer picture of Layer 1 performance and liquidity trends.
This analysis is intended to share insights and data with the community. It is not financial advice, and users should conduct their own research before making any trading decisions.