Bitcoin is at $68,000.
And nobody can agree on where it's going next.
The bears say: We're heading to $40K-$50K before any recovery.
The bulls say: This is capitulation $87K to $200K+ is next.
The range: $40,000 to $200,000+.
That's a 150% spread in predictions.
Same market. Same data. Completely different conclusions.
Let me break down what each side is seeing and why both might be partially right.
The Full Spectrum: $40K to $200K
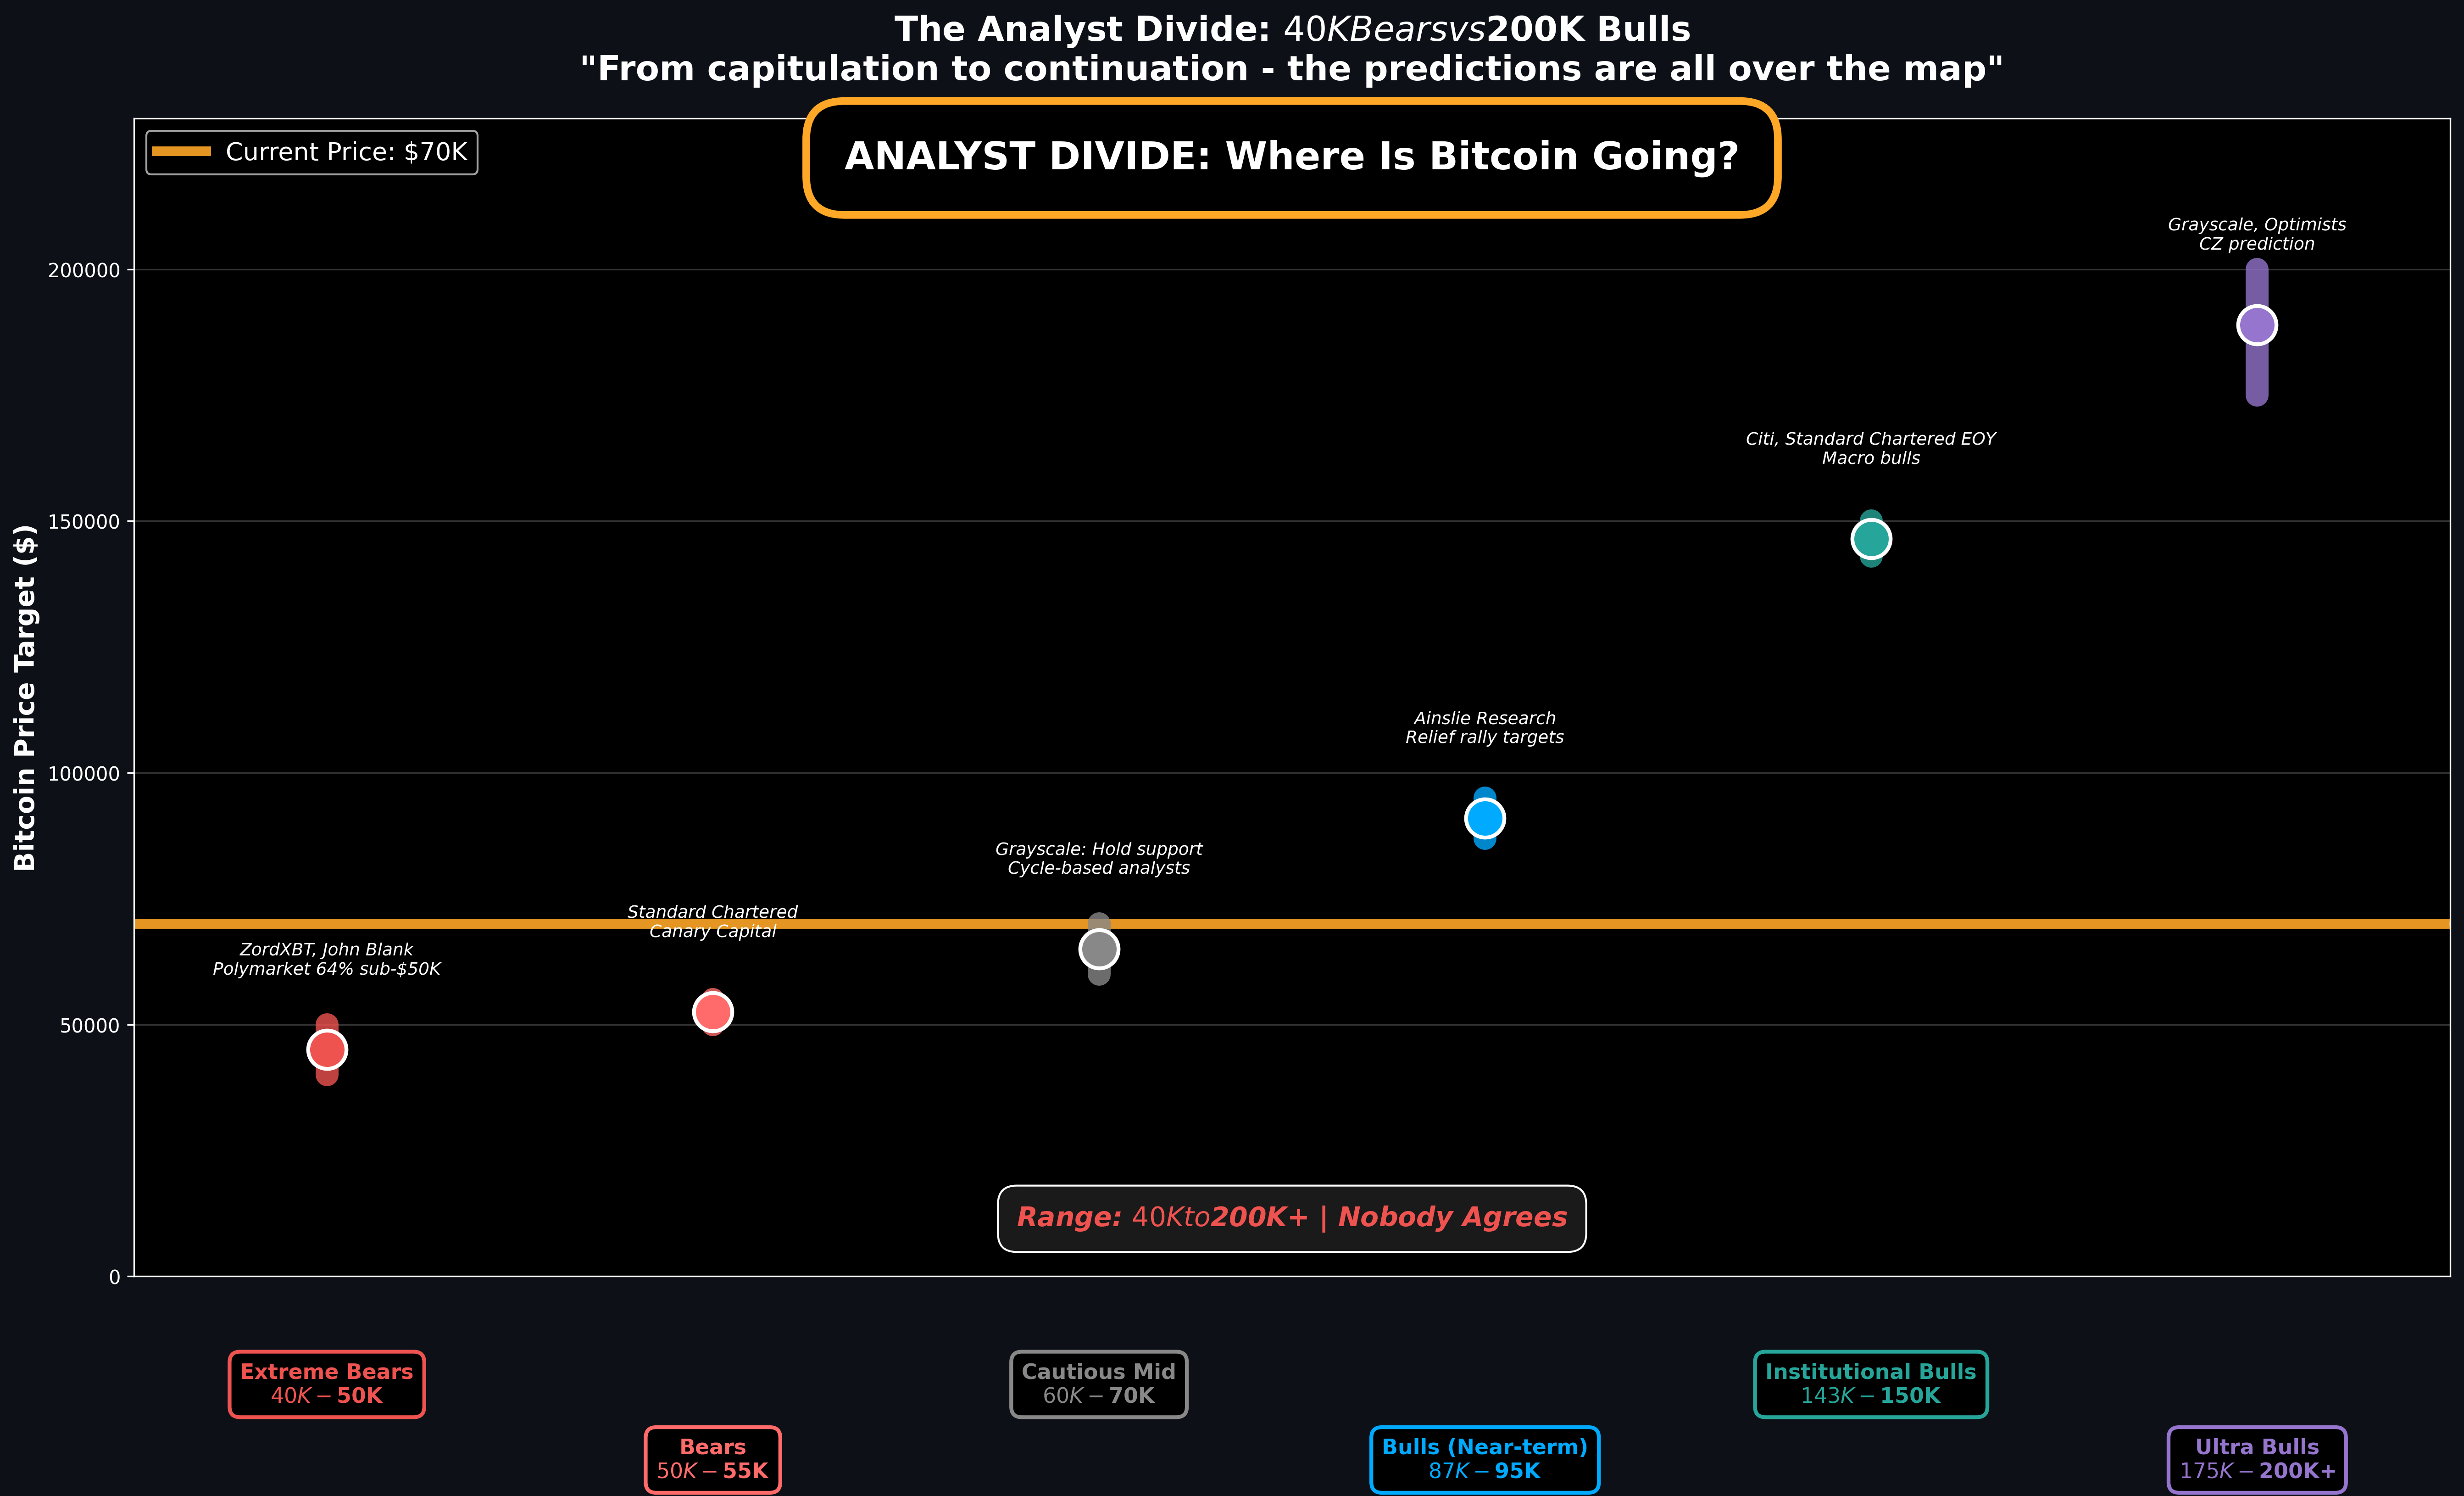
Extreme Bears: $40K-$50K
Who: ZordXBT, John Blank (Zacks), Polymarket traders
The call: Bitcoin drops to $40K-$50K, possibly wicking to $32K
Their argument:
Historical bear markets see 75-85% drops from ATH
Current 46% drop ($126K → $70K) isn't enough
Final capitulation hasn't happened yet
Polymarket odds: 64% chance Bitcoin goes sub-$50K
Bears: $50K-$55K
Who: Standard Chartered, Canary Capital (Steven McClurg)
The call: Drop to $50K by summer, then recovery to $100K by EOY
Their argument:
ETF outflows continuing ($817M single day, $1.33B weekly)
Average ETF buyer sitting on -25% loss (bought at $90K)
Macro headwinds (high rates, sticky inflation)
Four-year cycle entering bear phase
Standard Chartered's exact words: "We are going to see more pain and a final capitulation period for digital asset prices in the next few months."
Cautious Middle: $60K-$70K Range
Who: Grayscale, cycle-based analysts
The call: Hold current support, range-bound 2026
Their argument:
BTC correlating with high-growth tech stocks
Not acting as "digital gold" yet
Might be a "breather year" in the four-year cycle
Support should hold at $60K-$70K
Bulls (Near-Term): $87K-$95K
Who: Ainslie Research (Chris Tipper), on-chain analysts
The call: Relief rally to $87K-$95K, then consolidation
Their argument:
Bitcoin oversold vs 50/100-week moving averages
Historical rallies of 170-220% after undervalued zones
On-chain showing capitulation signals
Short-term bounce likely before next leg
Institutional Bulls: $143K-$150K
Who: Citi, Standard Chartered (end-2026 target), Grayscale
The call: $143K-$150K by end of 2026
Their argument:
ETF demand will return
Institutional adoption still early
Fed rate cuts coming (eventually)
Four-year cycle might break (no traditional bear in 2026)
Citi's framework: Base case $143K, bull case $189K, bear case $78K
Ultra Bulls: $175K-$200K+
Who: Grayscale (new ATH in H1 2026), CZ, crypto-native analysts
The call: New all-time high above $150K, possibly $200K+
Their argument:
Spot ETFs changed the game (no more 80% crashes)
Institutional demand is structural, not cyclical
Supercycle thesis (2026 won't be a bear year)
Bitcoin's scarcity + growing demand = inevitable
Grayscale's specific call: "Bitcoin's price will likely reach a new all-time high in the first half of the year"
The Bear Case: Why $50K Could Happen
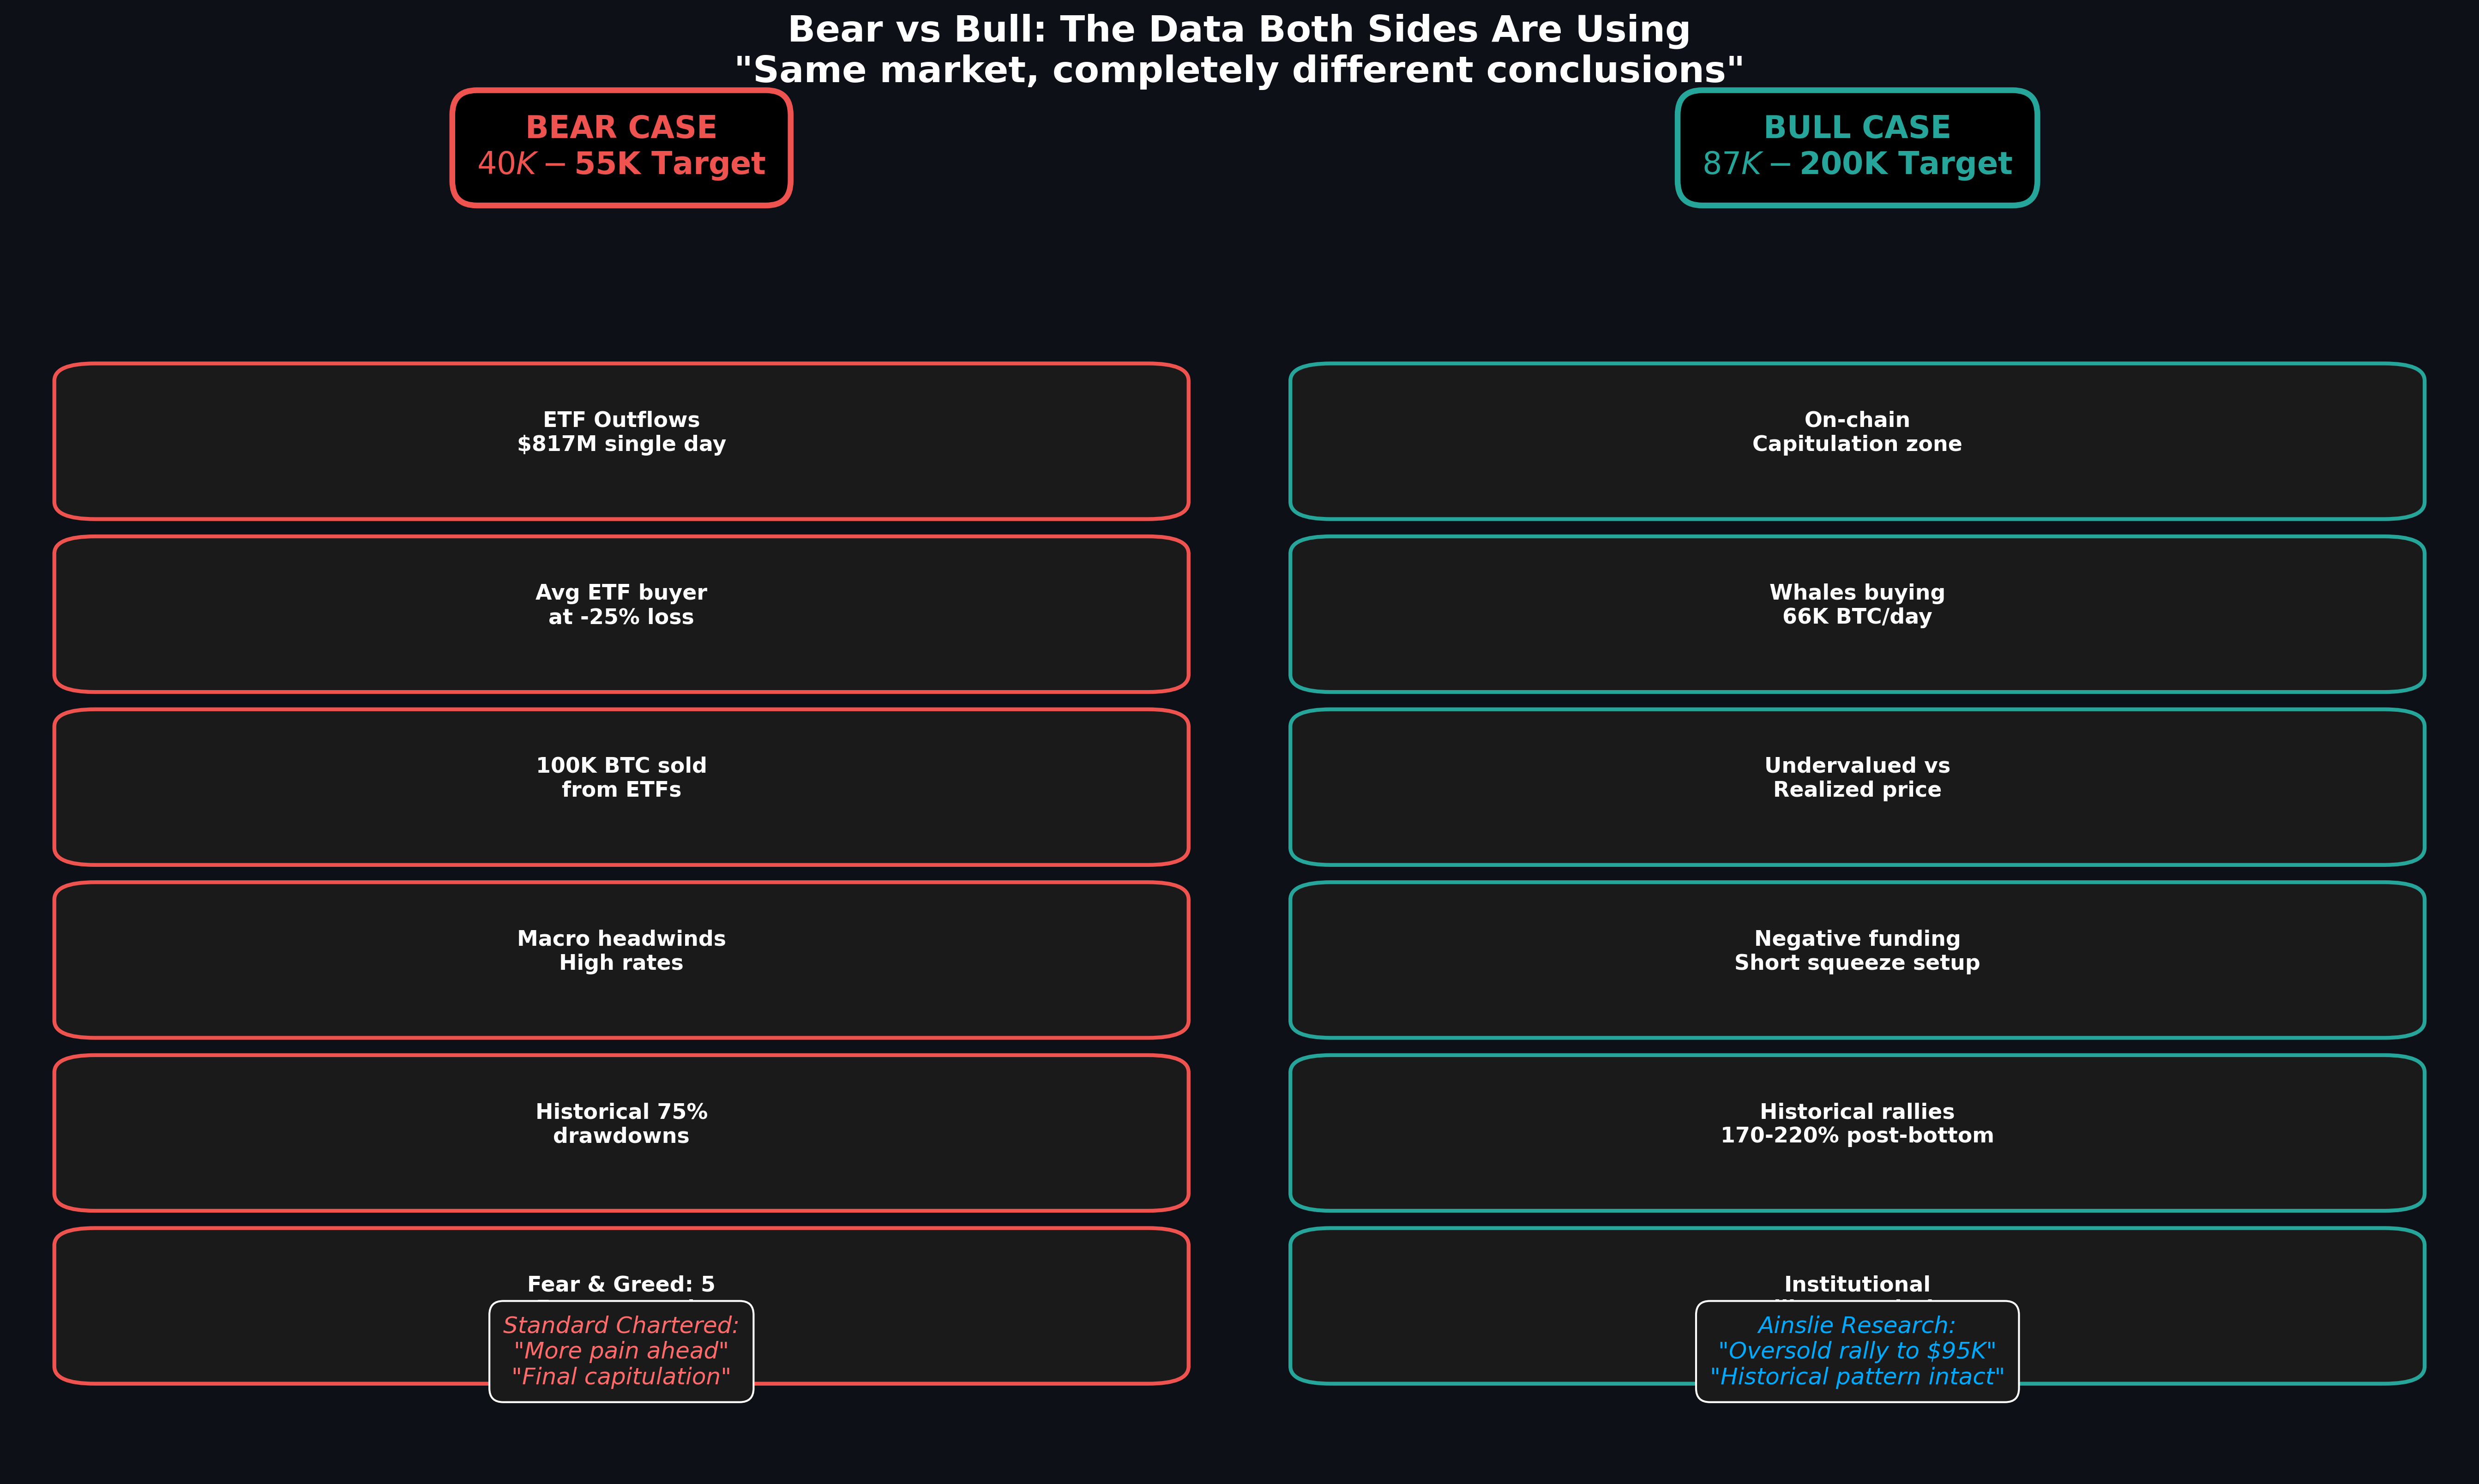
1. ETF Outflows Are Real
The numbers:
ETF holdings down 100,000 BTC from October peak
Total AUM dropped 41%: $165B → $96B
Average ETF buyer entry price: $90K
Current price: $70K
Loss: -22%
What bears say: Institutions aren't buying the dip. They're selling. When your average buyer is underwater, they don't add they cut losses.
2. Historical Drawdowns Go Deeper
Past bear markets:
2018: -85% ($20K → $3K)
2022: -78% ($69K → $15.5K)
Current:
2026: -46% ($126K → $70K)
What bears say: We're only halfway through a typical bear market. History says we go lower.
3. Macro Is Getting Worse
Fed not cutting rates yet
Inflation still sticky at 2.9-3.1%
Dollar strengthening (bad for $BTC )
Tech stocks correlating down
What bears say: Bitcoin trades like a risk asset. Risk-off environment = more downside.
4. Standard Chartered's Warning
October 2025: $200K for 2025, $300K for 2026
December 2025: Cut to $100K for 2025, $150K for 2026
February 2026: Cut again to $50K near-term, $100K for EOY 2026
What bears say: If a major bank keeps slashing forecasts, they're seeing real deterioration.
The Bull Case: Why $87K-$200K Could Happen
Now let me show you the data bulls are using.
1. On-Chain Says: Capitulation Zone
The signals:
SOPR (Spent Output Profit Ratio) below 1 = sellers realizing losses
Long-term holders selling at historic rates
Exchange outflows accelerating (whales accumulating)
Fear & Greed Index hit 5 (lowest ever, worse than FTX collapse)
What bulls say: Extreme fear + whale accumulation = classic bottom formation.
Example: On February 6, whales bought 66,940 BTC in a single day largest since 2022.
2. Undervalued vs Realized Price
Realized Price: $55K (average cost basis of all Bitcoin)
Current Price: $70K
What bulls say: We're trading near realized price. Historically, this is where bottoms form, not where crashes accelerate.
3. Negative Funding Rates = Short Squeeze Setup
Funding rates have been negative for multiple days.
Translation: Shorts are paying longs. Market is overleveraged to the downside.
What bulls say: When everyone's short, a bounce can trigger a massive short squeeze forcing shorts to buy back, spiking price.
4. Historical Rally Patterns
After extreme fear + capitulation:
2018: +316% rally (from $3.2K to $13K in 6 months)
2020: +1,625% rally (from $4K to $69K)
2022: +715% rally (from $15.5K to $126K)
What bulls say: If this is capitulation, the next rally could be 200-300%+. That's $140K-$210K from current levels.
Who's Right?
Honestly? Maybe both.
Here's my take on how this could play out:
Scenario 1: Bears Win Short-Term, Bulls Win Long-Term
BTC drops to $50K-$55K (capitulation)
Stays there for weeks/months
Then rallies to $87K-$100K by EOY
New ATH ($150K+) in 2027
Probability: 40%
This fits Standard Chartered's revised forecast and historical patterns.
Scenario 2: We Already Bottomed at $67K
$70K holds
Relief rally to $87K-$95K
Consolidation, then continuation to $120K-$150K
Probability: 30%
This fits the bull case if Fear & Greed 5 marked the bottom.
Scenario 3: Deeper Crash to $40K Range
Breaks $60K support
Capitulation wick to $40K-$50K
Then recovery begins
Probability: 20%
This fits the extreme bear case and Polymarket odds.
Scenario 4: Supercycle (No Traditional Bear)
Consolidates at $70K-$80K
Rallies to new ATH by mid-2026
No deep bear market
Probability: 10%
This fits Grayscale's "end of four-year cycle" thesis.
The Key Data Points to Watch
Forget predictions. Here's what to actually monitor:
1. ETF Flows
If flows turn positive: Bulls are right.
If outflows continue: Bears are right.
Current: Negative. Watch for reversal.
2. Fear & Greed Index
Currently: 15 (Extreme Fear)
If it drops below 10: Possible final capitulation.
If it starts rising: Bottom might be in.
3. $60K Support
Holds: Bulls have a case.
Breaks: Bears take control, next stop $50K.
4. Funding Rates
Stay negative: Short squeeze setup.
Flip positive: Longs getting squeezed instead.
What Should You Do?
Here's my honest advice:
If You're Waiting to Buy
Don't go all-in at one level.
Layer your entries:
20% at current ($70K)
30% at $60K
50% at $50K
This way you get exposure if bulls are right, but have dry powder if bears are right.
If You're Already Holding
Don't panic sell.
If you believe long-term (2-5 years), this chop doesn't matter.
Bitcoin at $40K, $50K, or $70K all cheap if it's going to $150K-$200K eventually.
If You're Trading
Respect the range.
We're in $60K-$80K chop. Trade the bounces, take profits, don't over-leverage.
The Bottom Line
#bitcoin is at $70,000.
Bears see: $40K-$55K before recovery.
Bulls see: $87K-$200K+ next.
The truth? Nobody knows.
But here's what we DO know:
✅ #etf outflows are real (bearish)
✅ On-chain capitulation signals are real (bullish)
✅ Macro is challenging (bearish)
✅ Fear & Greed at historic lows (bullish)
✅ Historical bear markets go deeper (bearish)
✅ Historical bottoms have this exact setup (bullish)
Both sides have valid data.
The market will decide who's right.
What's your take are we going to $50K before $100K, or is $70K the bottom? And which analyst camp are you in? Let me know below.