Making decisions in crypto isn’t just about watching price charts. Traders and investors usually combine different tools: technical charts, fundamental data, and overall market mood. The challenge is that there are so many metrics available that trying to track all of them can quickly become overwhelming.
That’s where the Crypto Fear and Greed Index comes in. Instead of analyzing dozens of separate indicators, it combines key sentiment and market data into one simple number. While it shouldn’t be used on its own, it can offer a helpful snapshot of how the broader crypto market is feeling at any given time.
What Exactly Is an Index?
An index is essentially a statistical measure that combines multiple data points into one value.
Take the Dow Jones Industrial Average (DJIA), for example. It tracks the performance of 30 large U.S. companies and gives investors a broad sense of how the stock market is performing. You can’t buy the index itself directly, but you can invest in products that follow it.
The Crypto Fear and Greed Index works differently. It’s not an asset or financial product you can purchase. It’s simply a market indicator designed to support analysis.
Understanding Market Indicators
Market indicators help traders interpret data more efficiently. Instead of manually reviewing countless data points, these tools summarize information in digestible ways.
There are generally three types of market analysis:
Technical analysis (TA) focuses on price charts, trading volume, and statistical tools like moving averages or Ichimoku Clouds.
Fundamental analysis (FA) evaluates an asset’s intrinsic value by looking at factors such as adoption, development activity, and total market capitalization.
Sentiment analysis measures how investors feel. It often draws from social media trends, community discussions, and public interest.
The Crypto Fear and Greed Index falls into the sentiment category. Other sentiment-based tools exist as well, such as Augmento’s Bull & Bear Index or WhaleAlert, which tracks large crypto transfers. In crypto markets especially, social media and public discussion can strongly influence price movements — which makes sentiment analysis particularly relevant.
What Is the Fear and Greed Index?
The original Fear and Greed Index was created by CNNMoney for stock markets. Later, Alternative.me adapted the concept specifically for cryptocurrencies.
The idea is simple: measure whether market participants are acting out of fear or greed.
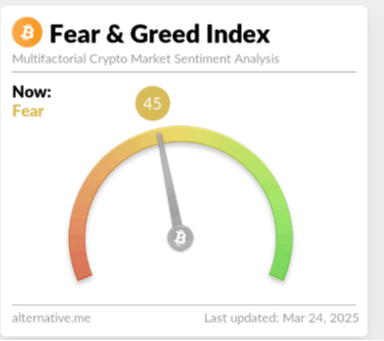
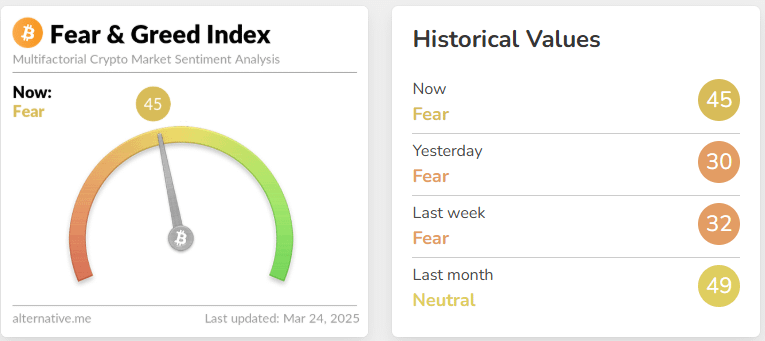
The index produces a daily score between 0 and 100:
0 represents extreme fear
100 represents extreme greed
50 suggests a relatively neutral market
A fearful market may signal that assets are undervalued. When panic spreads, investors may sell excessively. However, fear doesn’t automatically mean the market has entered a long-term downtrend — it can simply reflect short- or mid-term sentiment.
On the other hand, extreme greed can suggest overvaluation. When investors rush in due to FOMO (fear of missing out), demand can push prices beyond sustainable levels, potentially creating bubbles.
How the Crypto Fear and Greed Index Is Calculated
The index updates daily, assigning a score from 0 to 100. As of March 2025, it primarily uses data connected to Bitcoin and other major cryptocurrencies. Bitcoin is heavily weighted because its price movements and sentiment tend to influence the broader market.
The scale is typically divided into four ranges:
0–24: Extreme fear (orange)
25–49: Fear (amber/yellow)
50–74: Greed (light green)
75–100: Extreme greed (green)
The score is calculated using several weighted components:
1. Volatility (25%)
This measures Bitcoin’s current volatility compared to its average volatility over the past 30 and 90 days. Higher-than-usual volatility is interpreted as increased uncertainty or fear.
2. Market Momentum and Volume (25%)
Current trading volume and market momentum are compared to 30- and 90-day averages. Strong and sustained buying activity tends to reflect greed or optimism.
3. Social Media Activity (15%)
This factor analyzes the volume and engagement of Bitcoin-related hashtags on X (formerly Twitter). An unusually high level of interaction often corresponds with rising greed rather than fear.
4. Bitcoin Dominance (10%)
Bitcoin dominance measures BTC’s share of the overall crypto market capitalization. A rise in dominance can indicate fresh capital entering Bitcoin or funds moving from altcoins into BTC.
5. Google Trends Data (10%)
Search behavior offers insight into public sentiment. For example, a spike in searches like “bitcoin scam” or “bitcoin price manipulation” suggests growing fear in the market.
6. Surveys (15%)
Survey data previously contributed to the score but has been paused for an extended period.
Is It Useful for Long-Term Analysis?
The index is generally more effective for short- to medium-term insight rather than long-term cycle prediction.
Even within broader bull or bear markets, there are repeated waves of fear and greed. These shifts can provide opportunities for swing traders. However, long-term investors (often referred to as HODLers) are unlikely to accurately predict full market cycle transitions using this indicator alone.
For broader perspective, it’s important to combine sentiment tools with technical and fundamental analysis.
As always, relying on a single metric is risky. Conduct your own research (DYOR), and only invest what you can afford to lose.
Tips:
The Crypto Fear and Greed Index simplifies a wide range of data — volatility, volume, social signals, search trends, and more — into one readable number. Instead of tracking all these metrics individually, traders can use the index as a quick reference for market mood.
Still, it works best as a complement to other tools. Used alongside technical and fundamental analysis, it can help you form a more balanced and informed view of the crypto market.


