TL:DR
Bitcoin is finding a bottom but probably still has some downside. Strong hand are probably accumulating Bitcoin and especially alts.
Introduction
Bitcoin is flashing multiple accumulation signals. But this downtrend has been so gradual and lacking in volatility it barely feels like a bear market to me. Just like the last bull market didn't feel like a bull market to many people use to the traditional volatility of Bitcoin and crypto.
The Top chart
This is pretty simple.
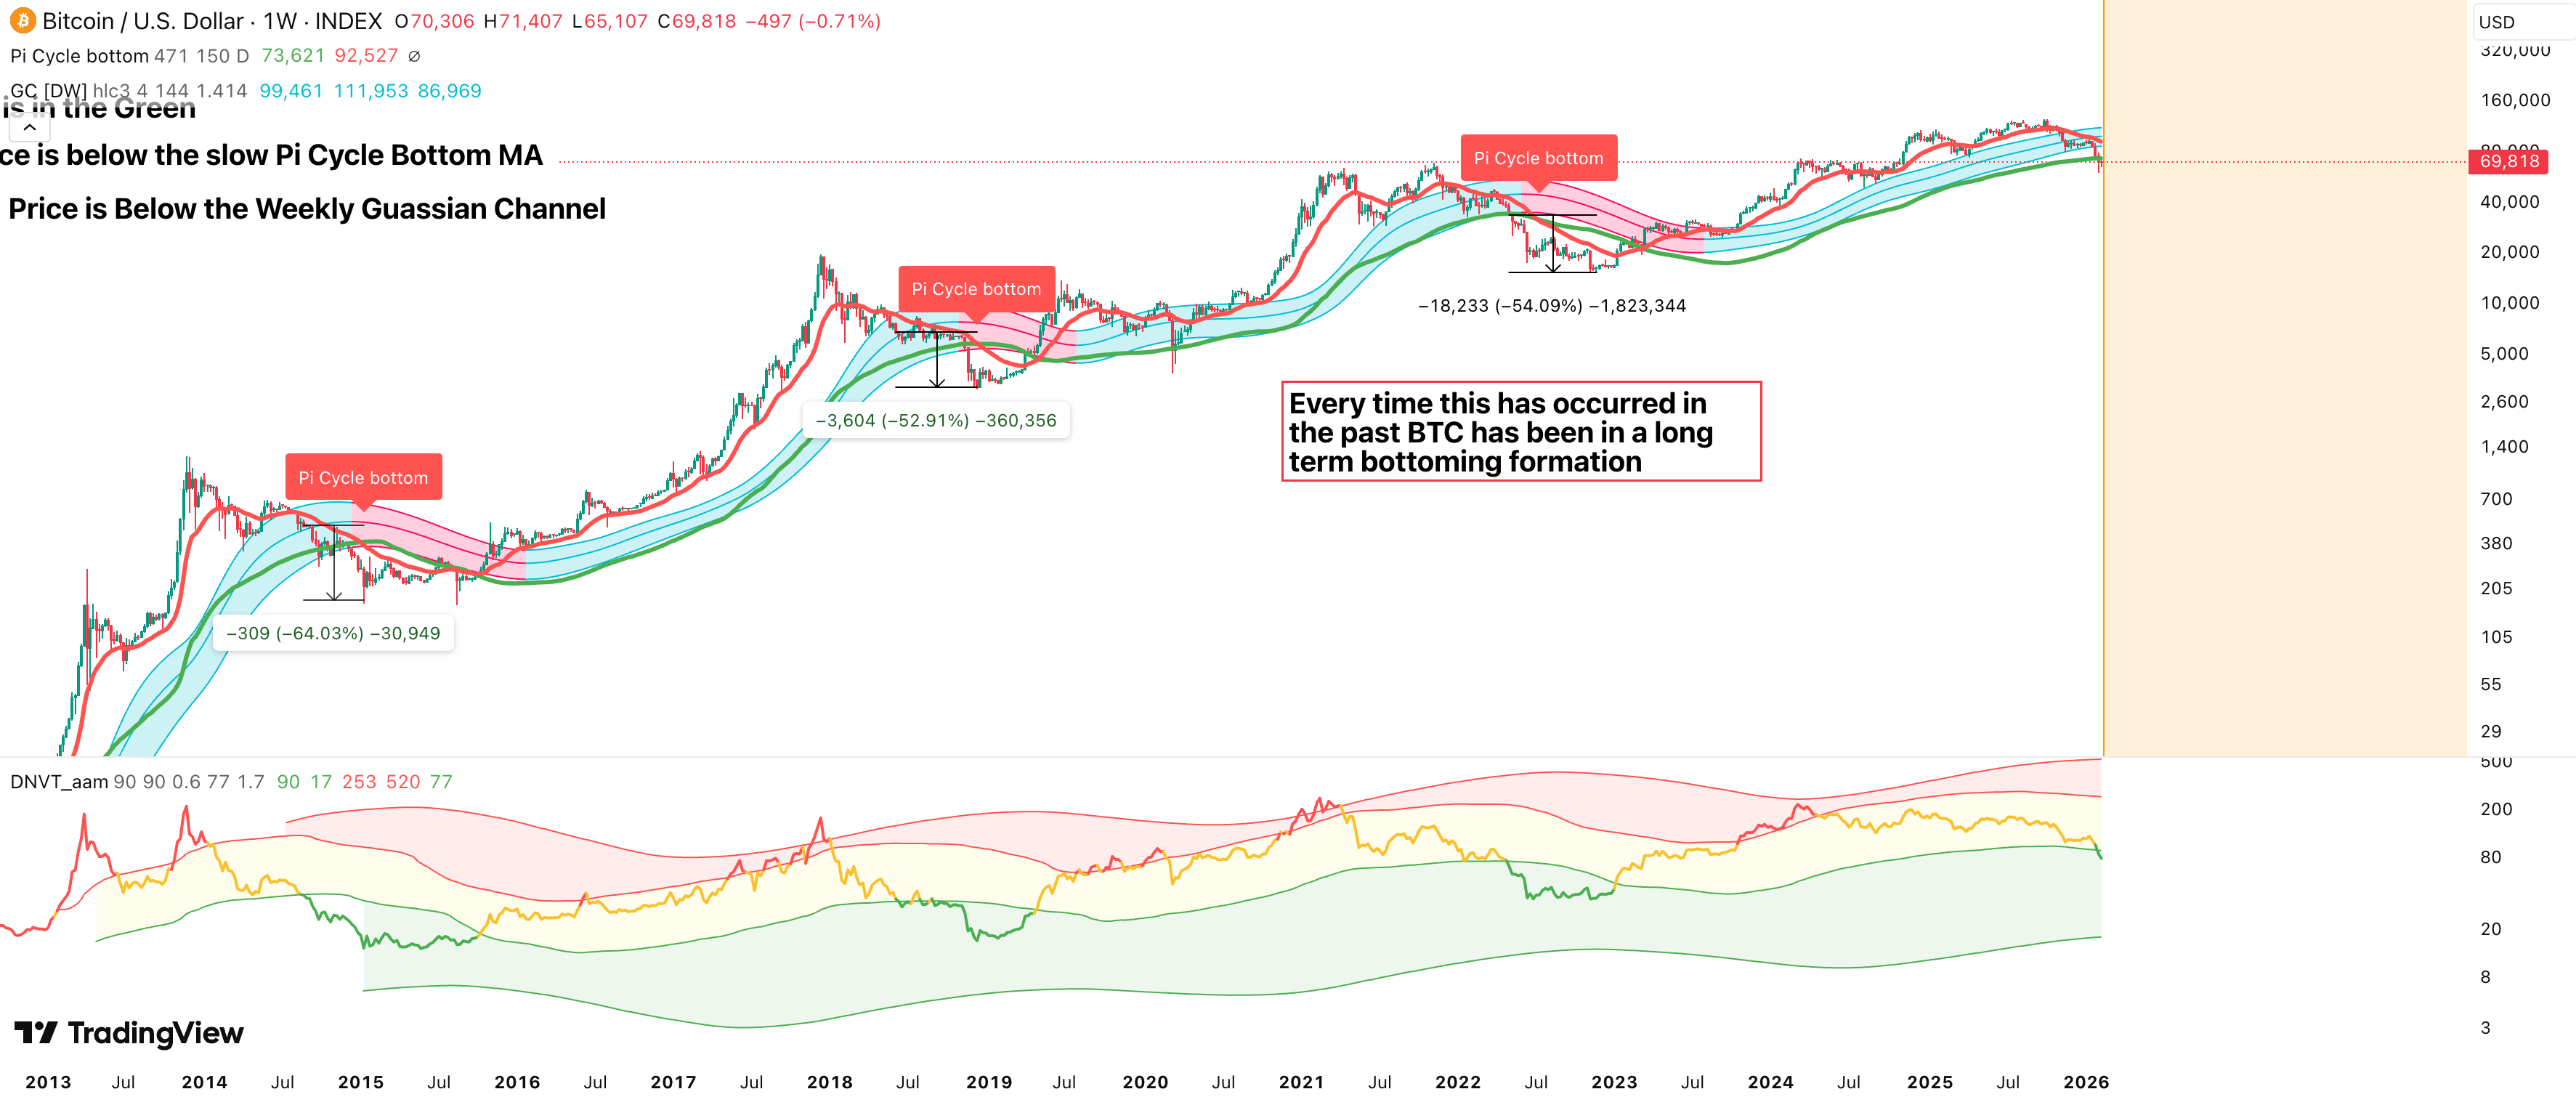
The Weekly NVT is green. Every time its been green before bitcoin has been in a bottoming formation. The NTV is based on the quantity theory of money (QTM) and basically says bitcoin is undervalued at this price level given the number of transactions.
Price is below the slow-moving average of the Pi-Cycle Bottom. Pretty simple. The Pi-Cycle bottom was backwards engineered to find bitcoin bottoms and does a good job of at least finding the reversal structure when the fast MA crosses below the slow MA. Of course, in order for this to happen price has to be below both the fast and slow MA, like it is now.
Price is below the weekly Gaussian Channel. Strong hands grab crypto when bitcoin is below the gaussian channel
It is absolutely vital to recognize that both the Pi Cycle bottom hasn't flashed a bottom nor has the gaussian channel turned red. Since both of those have not happened yet its fair to assume we will have both more downside and longer time in the accumulation zone.
BTC Monthly Chart
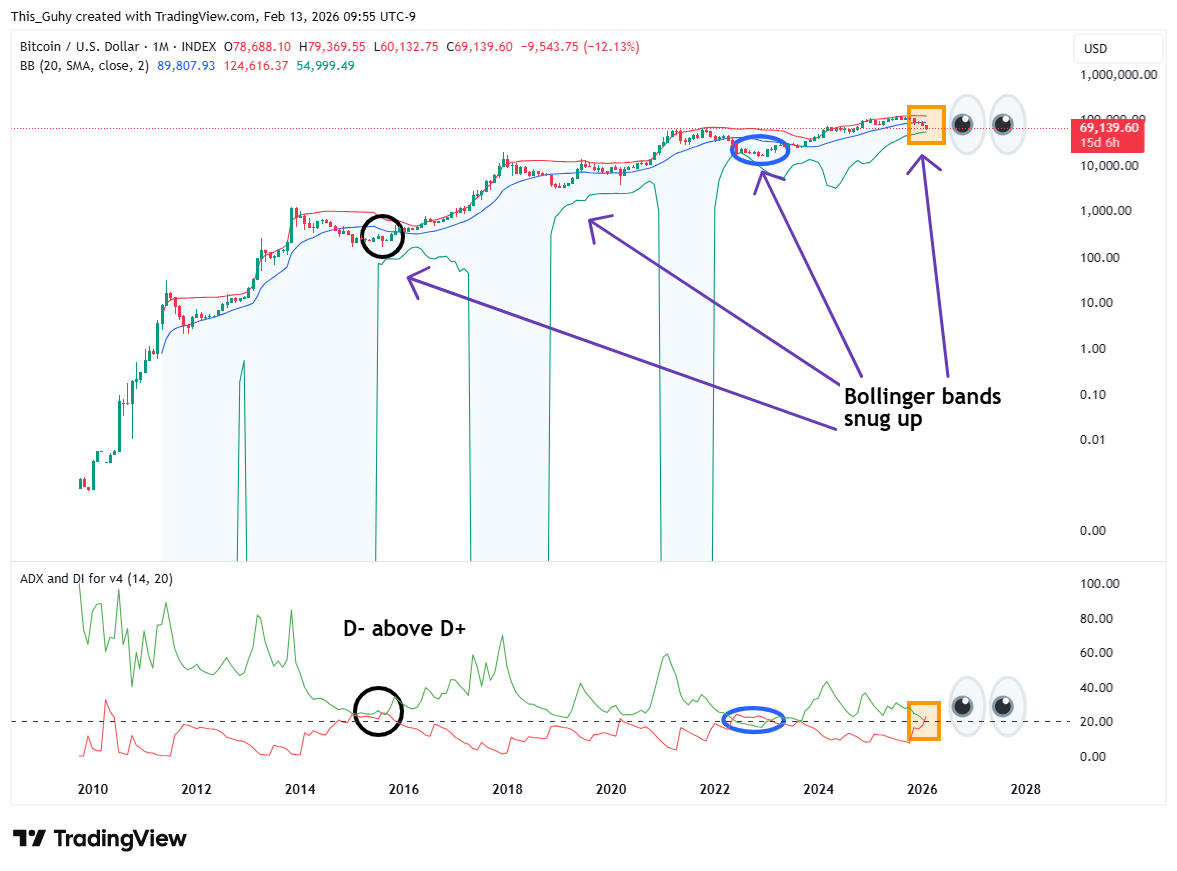
Pretty simple. Strong hands accumulate when the D- is above the D+. We have fewer examples on this chart than our top chart but the signal is clear. We also easily see the Bollinger band width has reduced and price is close to finding support on the band. In previous bear markets price didn't touch the base of the band for support but it did the last bear market. So we might or might not see bitcoin touch the bottom of the band time around.
Chart experimental overload
The meat of the idea has already been articulated. But I have some other charts I am looking at and this is just for funsies to justify yolo'ing more money into alts.
ETHBTC
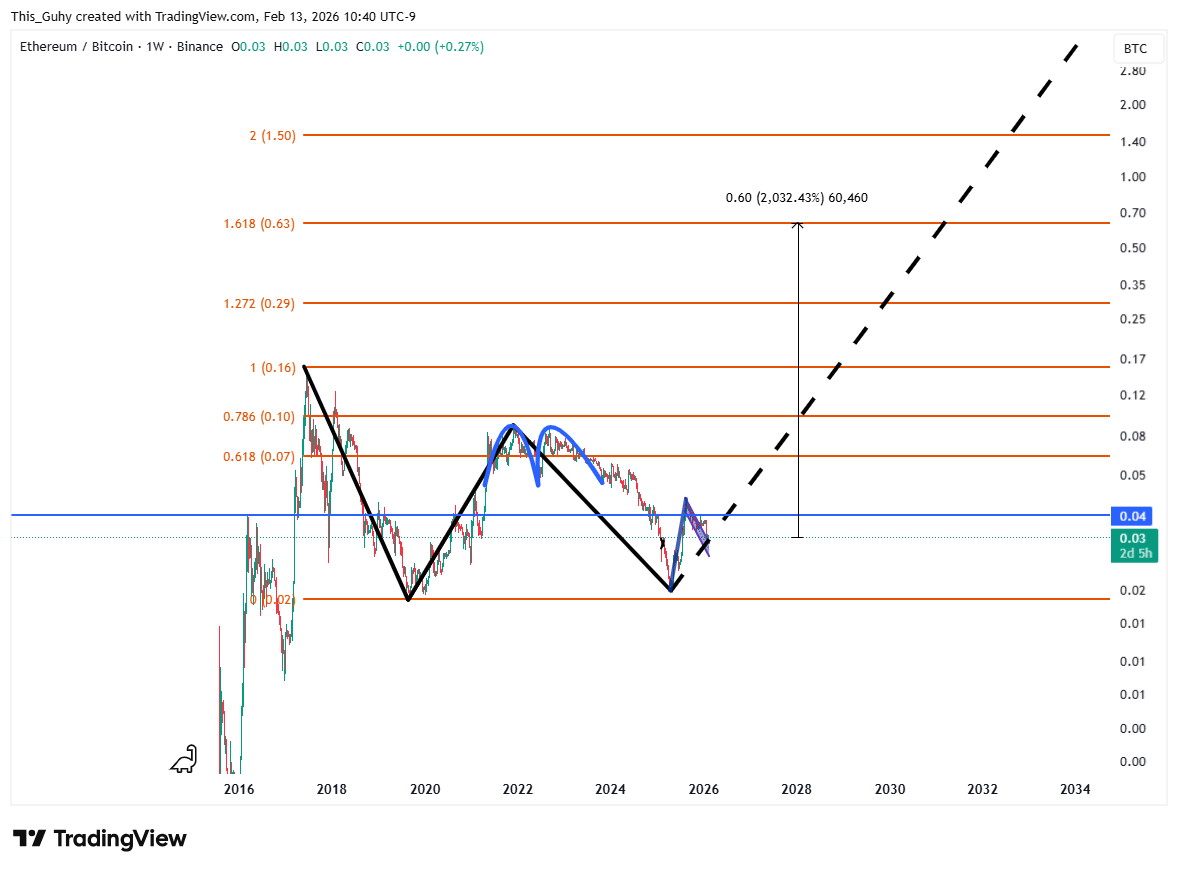
The least experimental chart. I have been posting on this since I recognized the double top years ago. Now we have an even bigger double bottom. Quite simply, so long as $ETH BTC is in this W pattern and hasn't reached the 1.618 I remain a macro bull on eth and alts. ETH$BTC will have times it might consolidate for years. I simply play the chart. It might stall at major fib levels and all time high. I will harvest profit.
bMonthly btcusd/silver
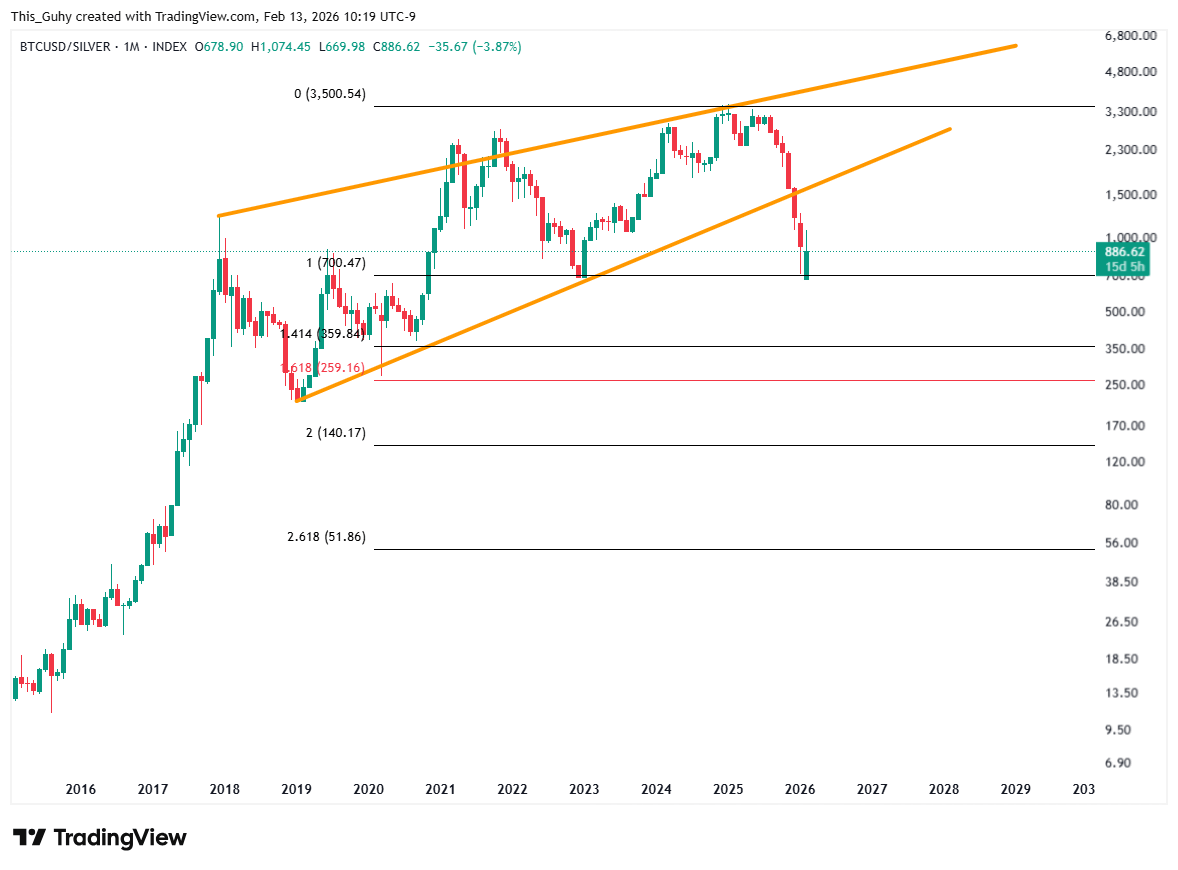
TBH bitcoin doesn't look like it is going to beat silver in the long run. It definitely looks like it is bouncing now. But its at a double top looking neckline to me as it comes out of a bearish rising wedge. I expect to see a bear flag develop at lower time frames.
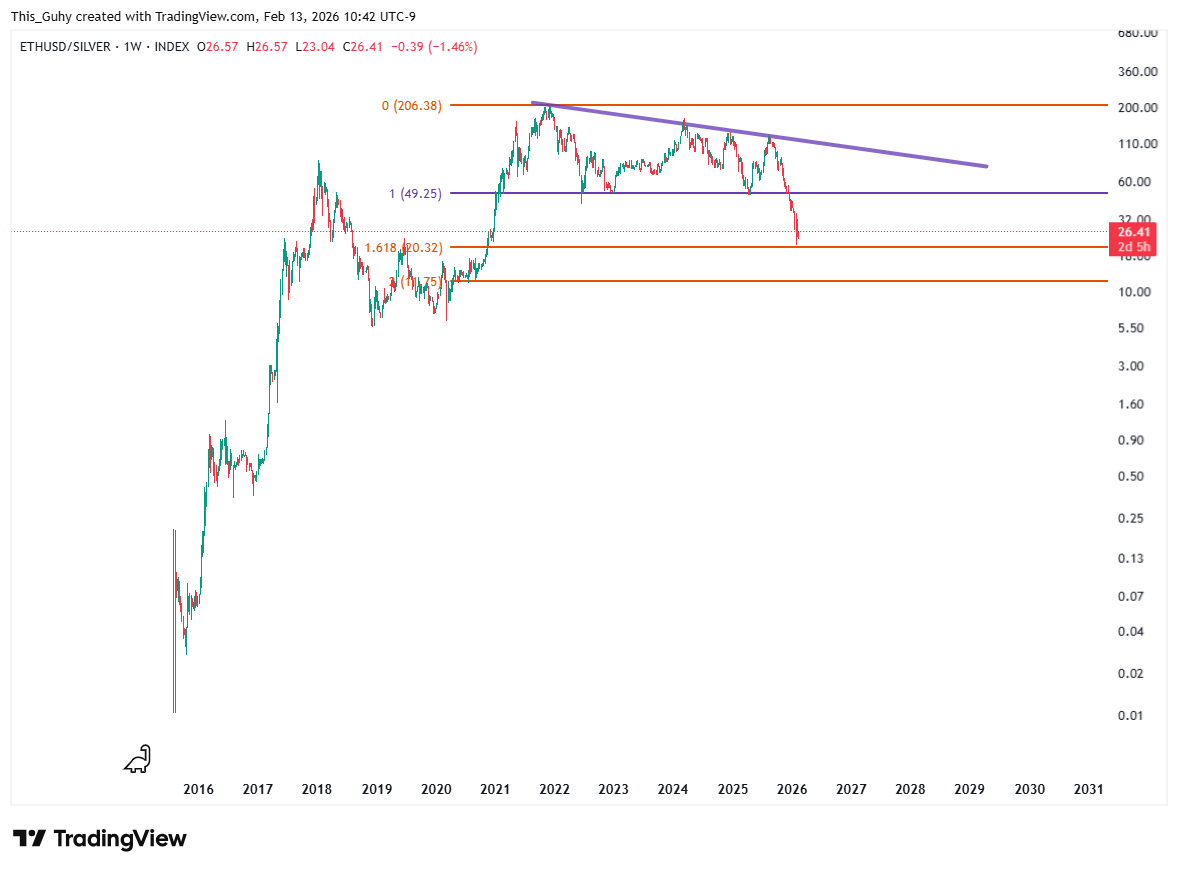
ETHUSD/Silver
At Descending Triangle 1.618 Target. That's good enough for a bounce or a reversal.
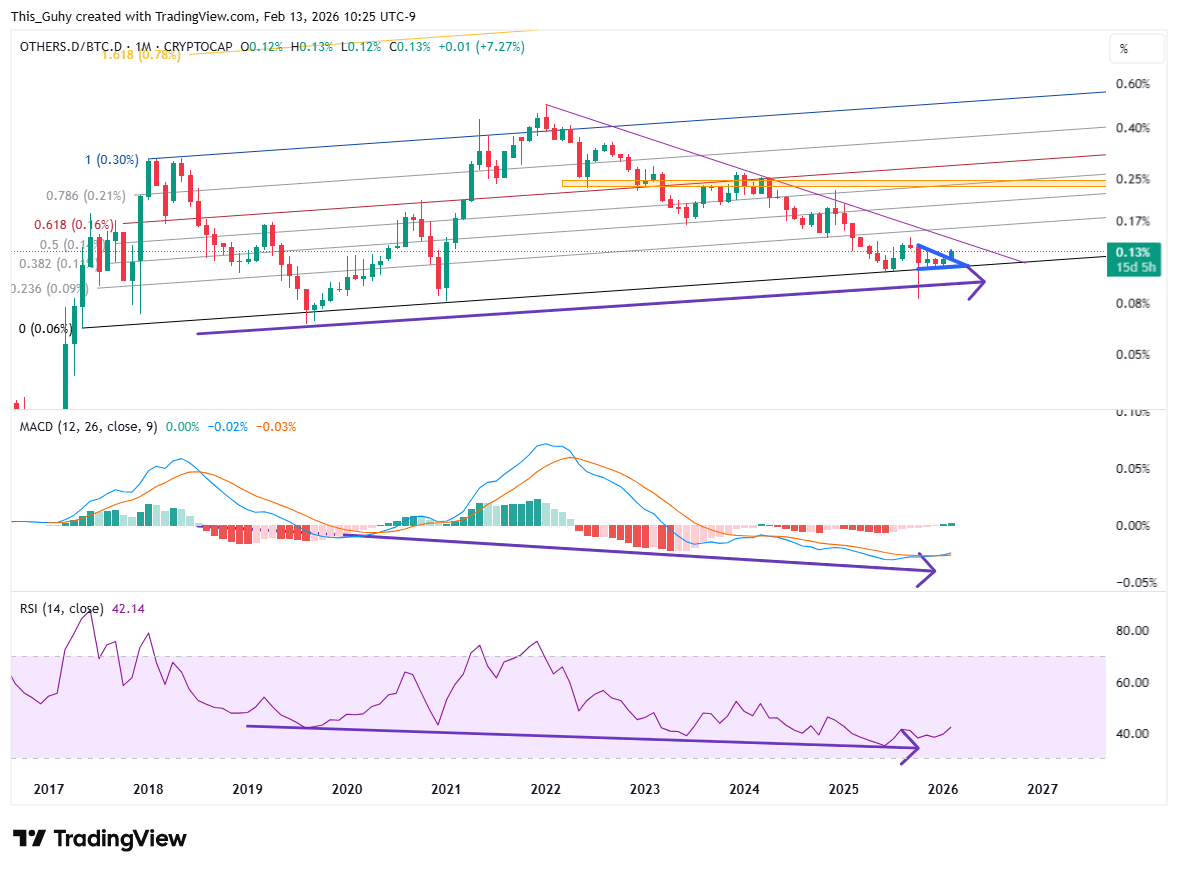
Others.d/btc.d
Want an alt season? then others.d has to go up faster than btc.d And we see it finding support in this channel with a lot of hidden bullish divergence. I expect the price action to reverse at the 0.618 fibline of the channel or at the previous support of the head and shoulders neckline
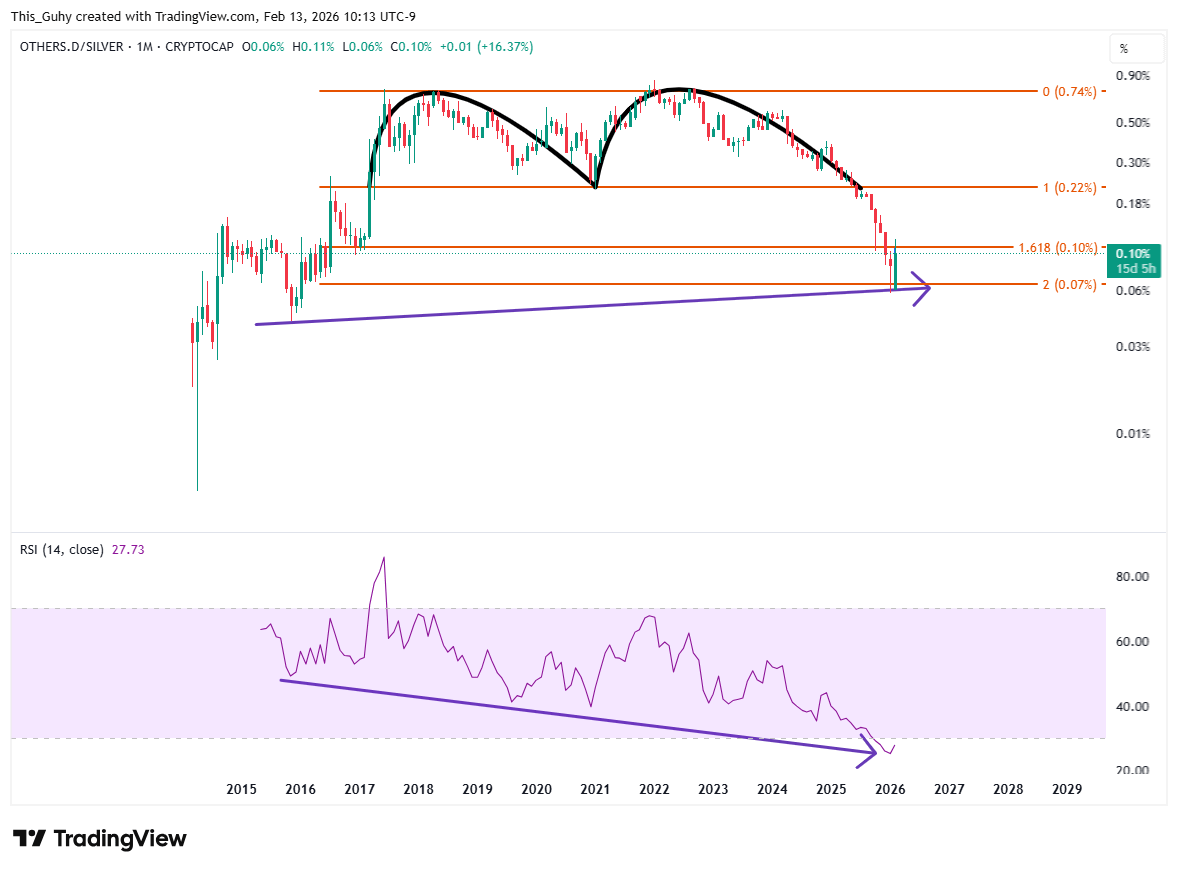
others.d/silver
I was just experimenting with this chart and saw a pattern. I like patterns. This double top reached its target and now has hidden bullish divergence. And look at that green celery stick of a candle right on the 2.0 fib line.
I am riding others until I see that silver might reverse it (at the double top neckline).
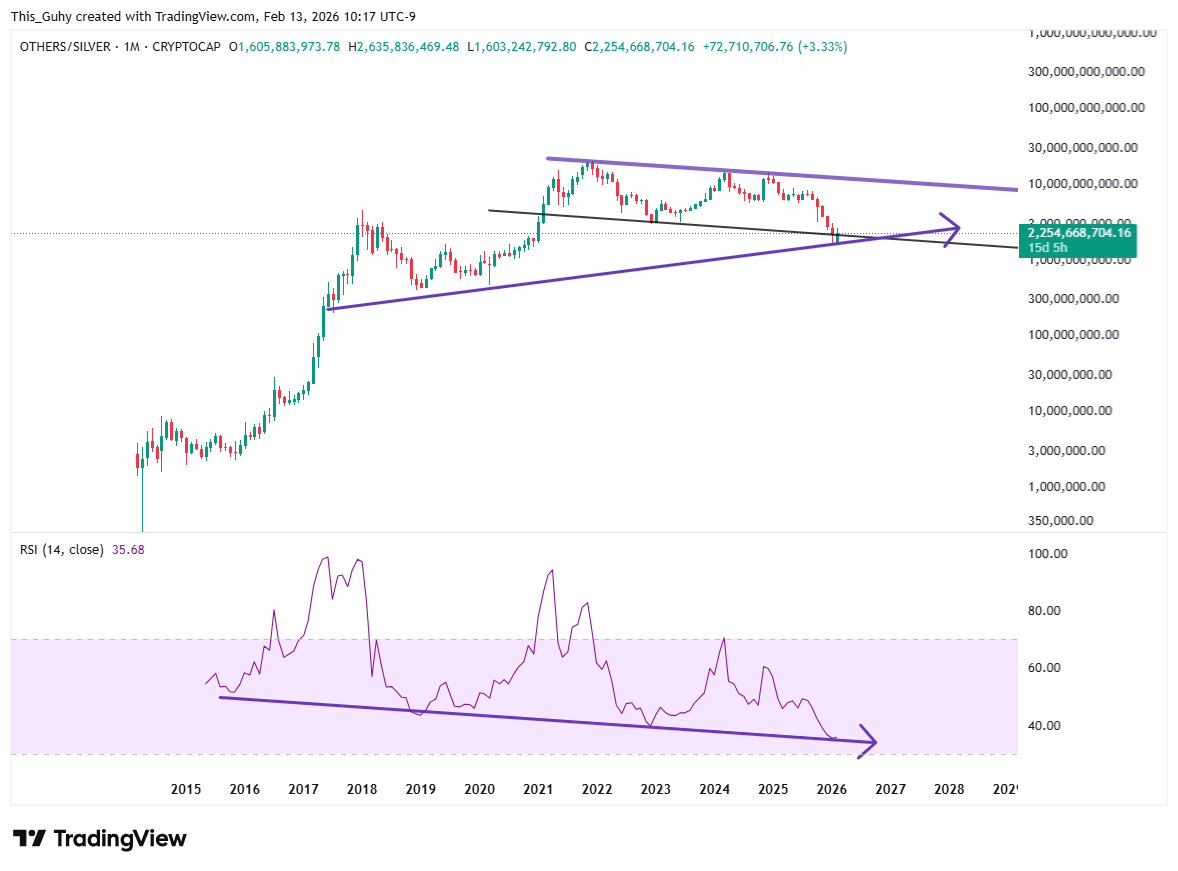
Others/silver
One experimental chart lead to another. Others/silver looks like it might be creating a triangle it could break out of later. Even better if the triangle breaks out to the upside.
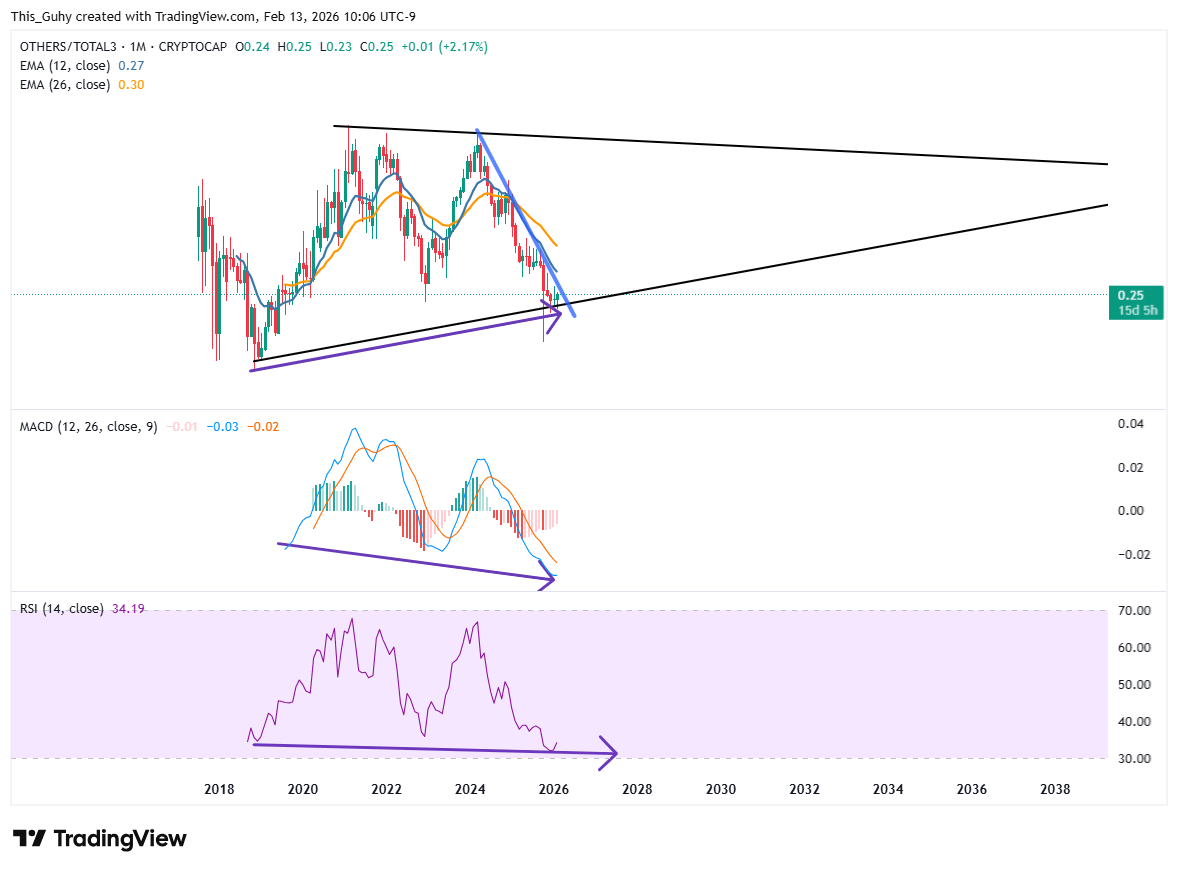
Others/Total3
This is another of my main alteason chart. Others is basically everything in the above the top 10 in marketcap. Total3 is everything but bitcoin and Ethereum. Altseason is really about everything above the top 10 going crazy. Crazier than the top 10 coins and definitely crazier than the top 2 coins.
Basically, bitcoin in accumulation and others/total3 painting a triangle suggest altseason is percolating. Waiting for a break out of the blue trendline.
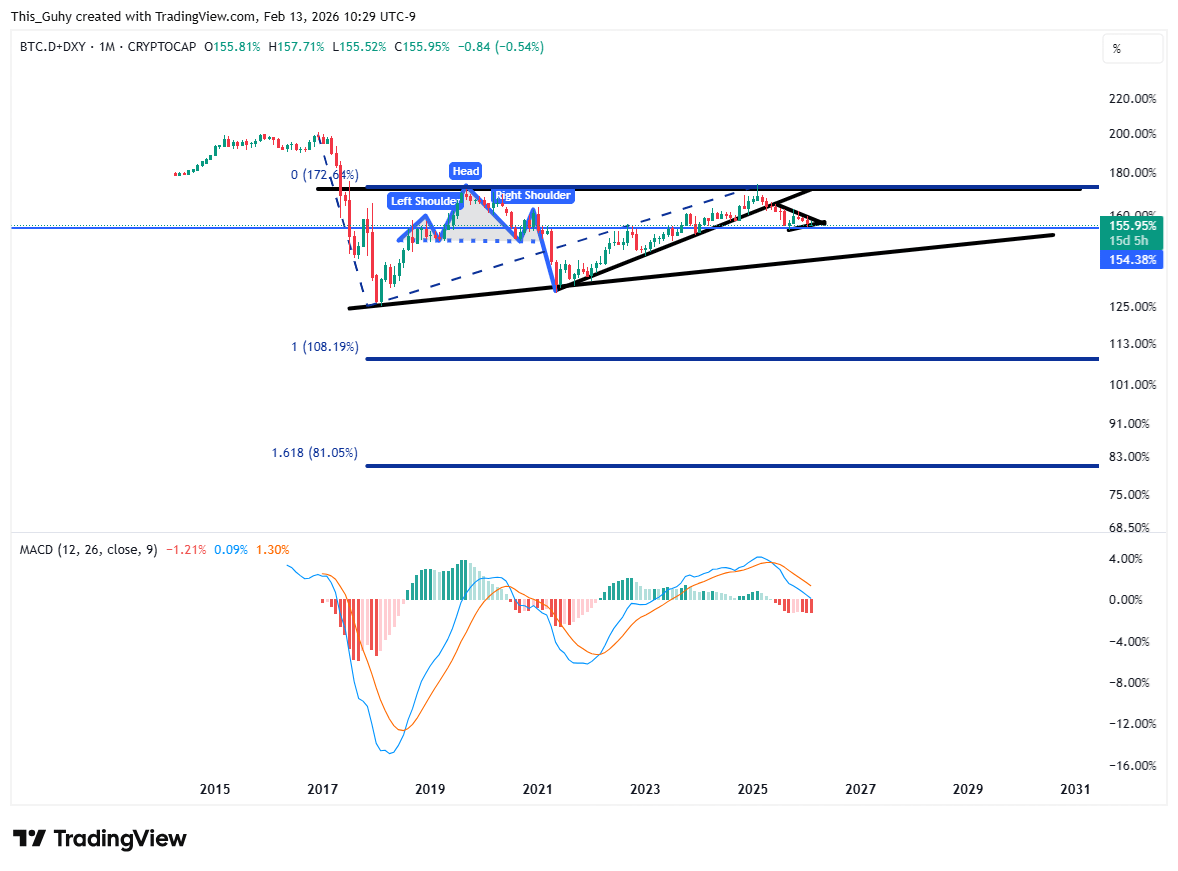
Dxy+btc.d
Alt season generally needs a declining dollar index and dropping bitcoin dominance. So why not smash the two into one chart? Here we go, with a breakdown target. Now I don't have to check btc.d and dxy seperately (but I still do, of course).
Conclusion
I'm in alts. Way up the risk curve from the top 10.
Bitcoin in accumulation and silver pausing and reversing against alts gives permission for this. When BTC.d or BTC+DXY, or DXY or Silver start to show strength then I have to manage that by either rotating into btc or silver.
Sure its a bit complicated but that makes it fun.
#BTC #alcoinseason #TrendingTopic

