When I first saw Bitcoin trading around $67K, it didn’t feel dramatic. Not euphoric, not panic. Just… heavy.
After going through the data properly, I understand why.
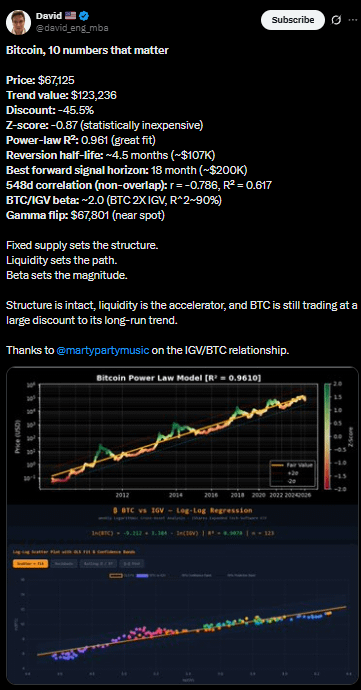
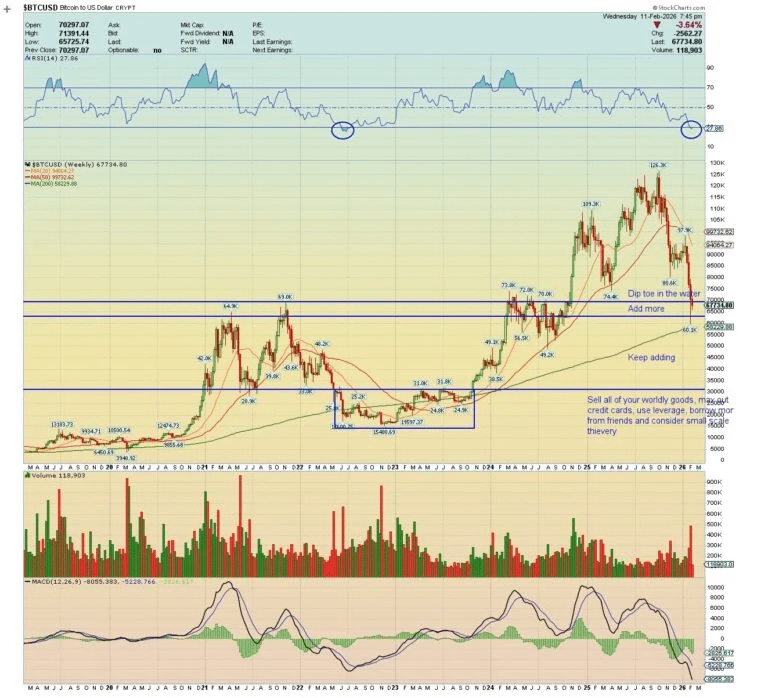
Bitcoin isn’t weak. It’s trading far below its long-term trend, and that changes how price feels.
Right now, Bitcoin’s estimated trend value is around $123K, while spot price sits near $67K. That’s roughly a 45% discount to trend. Historically, this kind of gap doesn’t happen near cycle tops. It usually shows up during periods where price pauses while structure continues building underneath.
Price Alone Doesn’t Say Much. Context Does.
Bitcoin at $67K is not cheap or expensive by itself. What matters is where it sits in the cycle.
In past cycles:
•Deep bear markets traded 60–80% below trend
•Peak cycles often traded 50–150% above trend
•Mid-cycle consolidation phases usually sit 20–50% below trend
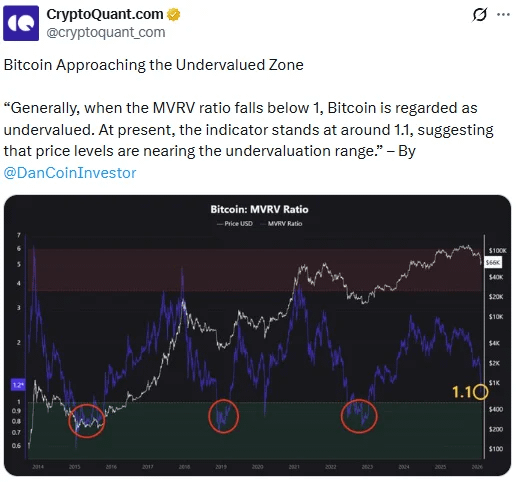
So at a 45% discount, Bitcoin is not in euphoria. It’s also not in panic territory. It’s in a statistical undervaluation zone, not a breakdown zone.
Valuation Metrics Say Bitcoin Is Inexpensive, Not Overheated
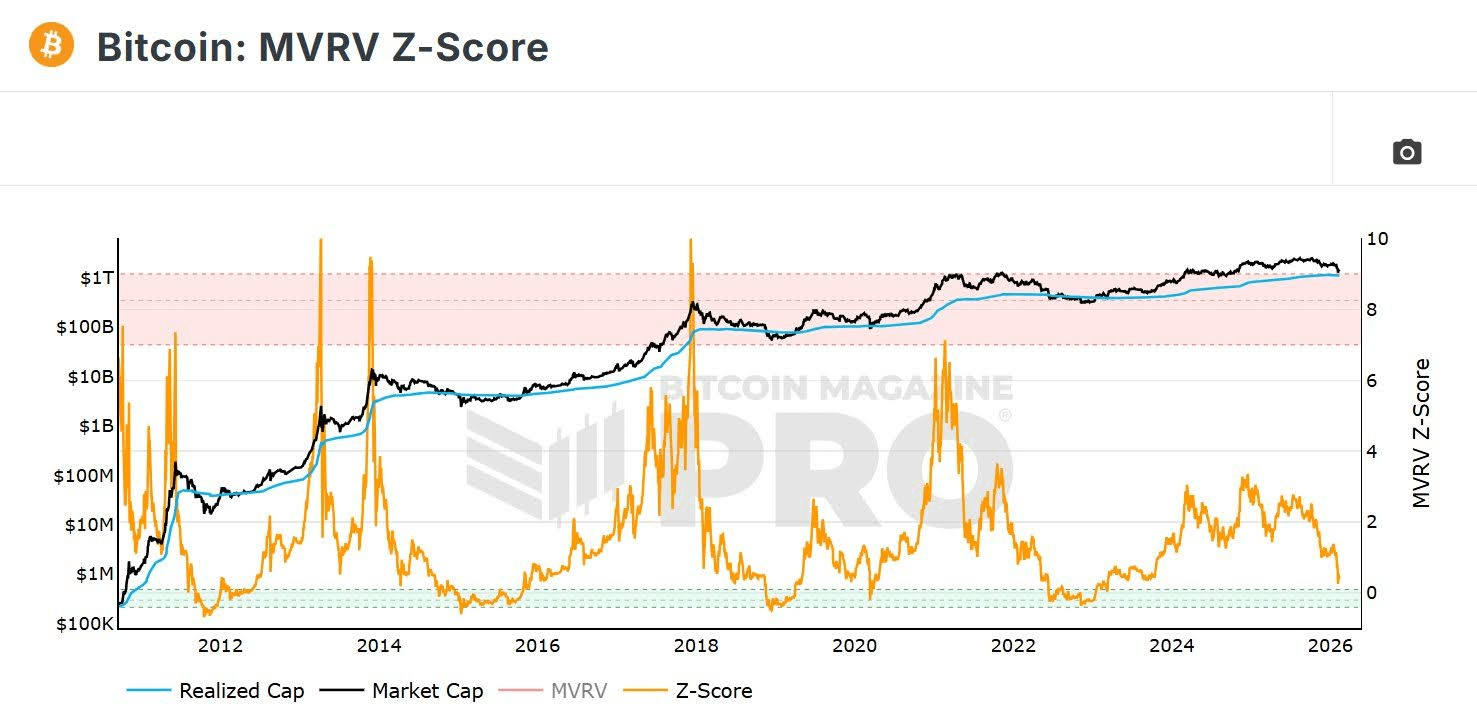
One metric that stood out to me is the Z-score.
Bitcoin’s Z-score is currently around -0.87, which means price is almost one standard deviation below its historical average. In simple terms, that suggests Bitcoin is statistically inexpensive, even if it doesn’t feel exciting.
Historically:
•Z-scores above +2 show overheating
•Around 0 means fair value
•Between -1 and -2 often marks accumulation zones
At -0.87, Bitcoin is undervalued relative to history, but not deeply distressed. That matters.
The Structure Hasn’t Broken
Another important point is the power-law model.
Bitcoin’s long-term price trend still fits extremely well, with an R² value around 0.96. That’s a strong fit for an asset this volatile. It tells us something important.
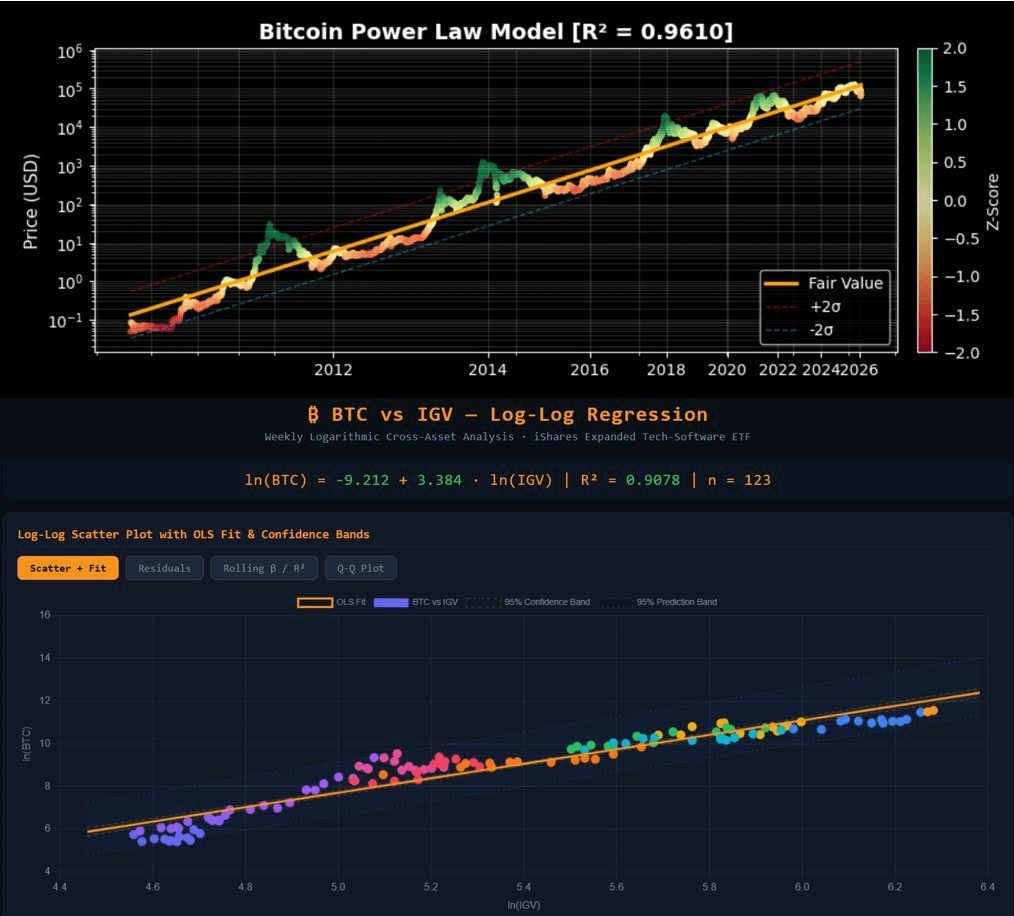
Despite short-term noise, Bitcoin’s long-term growth curve remains intact. Adoption, supply structure, and network effects haven’t collapsed. Price is moving slower than trend, not diverging from it.
Structure is still there.
Mean Reversion Is About Time, Not Speed
Bitcoin doesn’t snap back to trend overnight.
The data shows that when Bitcoin trades this far below trend, the average half-life for reversion is around 4.5 months. That doesn’t mean price shoots straight up. It usually means:
•Sideways movement
•Frustrating ranges
•Fake breakouts
•Weak hands leaving
This phase feels boring, but historically it’s normal.
Why the 18-Month Horizon Keeps Showing Up
One of the most important insights in the article is about time horizon.
Bitcoin’s strongest forward returns tend to show up 12–24 months after undervaluation phases, with the data pointing strongly toward an 18-month window.
This makes sense because Bitcoin cycles are slow:
•Liquidity shifts take time
•Institutional positioning is gradual
•Macro conditions don’t flip instantly
Short-term charts are noisy. Long-term positioning dominates returns.
Cycles Are Still There, Just Slower
The article also highlights Bitcoin’s 548-day correlation cycle. It shows that Bitcoin often moves inversely to its own price behavior from about 1.5 years earlier.
Right now, that correlation suggests Bitcoin is in a mean reversion phase, not a runaway expansion phase. That explains why price action feels sluggish even though fundamentals look fine.
Bitcoin Behaves Like a High-Beta Asset
Another thing people forget: Bitcoin is not just “digital gold”.
Bitcoin’s beta to growth assets like tech stocks is around 2.0, meaning it amplifies liquidity conditions. When liquidity expands, Bitcoin often outperforms. When liquidity tightens, Bitcoin underperforms.
So current price weakness doesn’t necessarily reflect Bitcoin’s internal health. It reflects macro liquidity pressure.
Derivatives Show an Inflection Point, Not a Blow-Off
One more important detail is the gamma flip level, sitting near current price.
This means options positioning is near a zone where price behavior can change. Above it, momentum can accelerate. Below it, moves can feel heavy and choppy.
That explains why price feels stuck instead of explosive.
Putting Everything Together
When I combine all of this, the picture becomes clearer.
Bitcoin is:
•Trading well below its long-term trend
•Statistically inexpensive
•Structurally intact
•In a mean reversion phase
•Sensitive to liquidity, not broken
This doesn’t guarantee immediate upside. Markets can stay discounted longer than expected. But historically, periods like this tend to reward patience, not prediction.
The next 18 months probably matter more than the next 18 days.