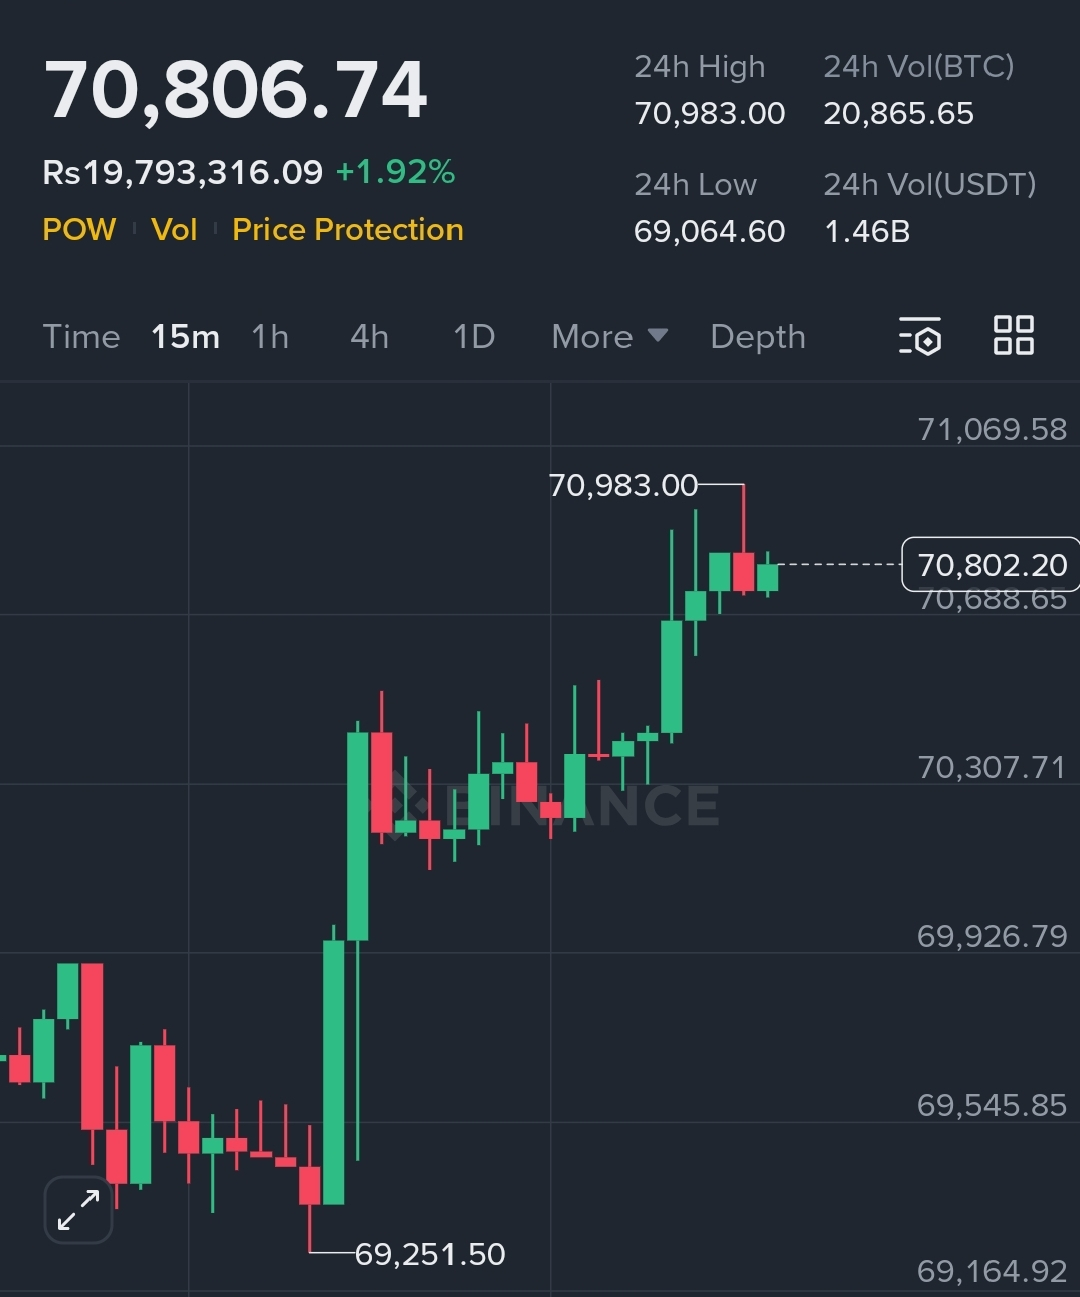
$BTC has rebounded strongly from the $69,250 intraday low and is now consolidating just below the $71,000 resistance zone. The structure shows:

Higher highs and higher lows on lower timeframes
Strong bullish impulse candle with volume expansion
MACD positive (DIF above DEA), momentum still bullish but slightly cooling
Price is currently ranging between $70,300 - $70,900, suggesting short-term consolidation before the next move.
Key Levels
Resistance Zones
$70,980–$71,100 (major intraday resistance)
Break above $71,100 - Possible push toward $71,800 - $72,500
Support Zones
$70,300 (minor support)
$69,900 - $70,000 (psychological + structure support)
$69,200 (strong demand zone)
Trade Scenarios
✅ Bullish Setup (Preferred While Above $70K)
Buy Zone: $70,100 - $70,300 on pullback
Target 1: $71,000
Target 2: $71,800
Stop Loss: Below $69,850
Bearish Setup (If Rejection at 71K)
Sell Zone: $70,950–$71,100
Target: $70,200 → $69,900
Stop Loss: Above $71,250
Current Market Sentiment
Momentum remains moderately bullish, but price is approaching a strong resistance cluster near $71K. A breakout with volume could trigger short liquidation and continuation upward. Failure to break may lead to short-term retracement before another attempt.
Short-Term Outlook (Next 12–24h)
Bias: Bullish-neutral
Confirmation needed above $71K for continuation.
Below $69,900 shifts momentum bearish.
#TradeCryptosOnX #MarketRebound #USNFPBlowout #BTC #BTCMarketInsights