If you are exhausted from jumping between countless indicators and still missing good opportunities, this article is meant for you. Most traders do not fail because they lack tools. They fail because their charts are cluttered. One indicator signals a buy, another flashes a sell. The broader trend looks bearish, and hesitation takes over.
In this piece, I will walk through a simple, trend based approach using the Nifty 50 Index on the five minute chart. The goal is clarity. I will explain each step clearly so you can trade without second guessing. Let’s dive into the method.
GK Trend Ribbon with CPR Structure
This setup relies on just two tools. CPR and the GK Trend Ribbon.
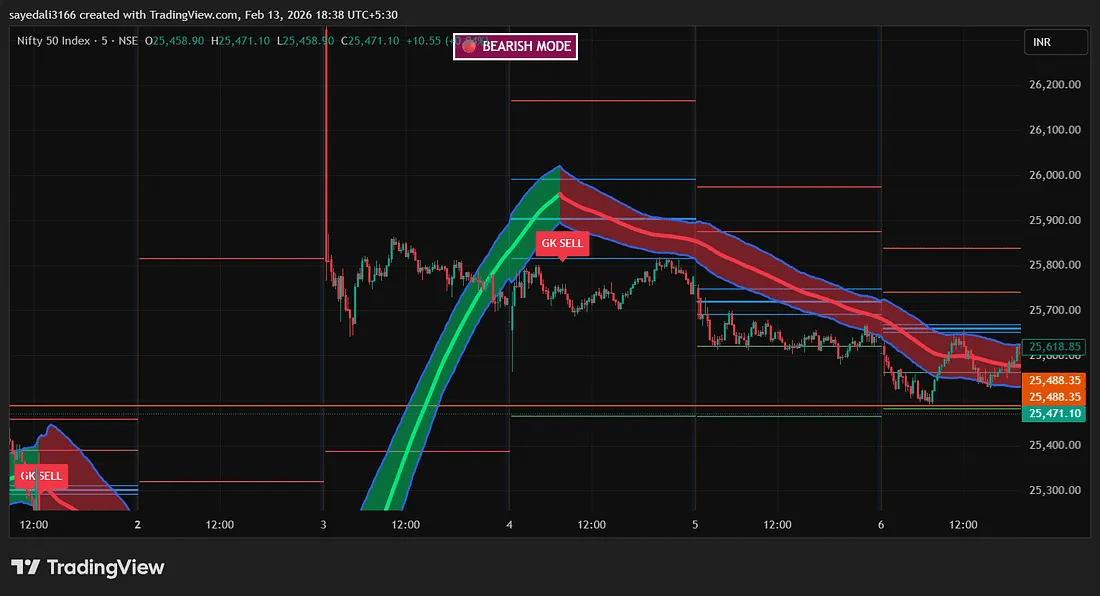
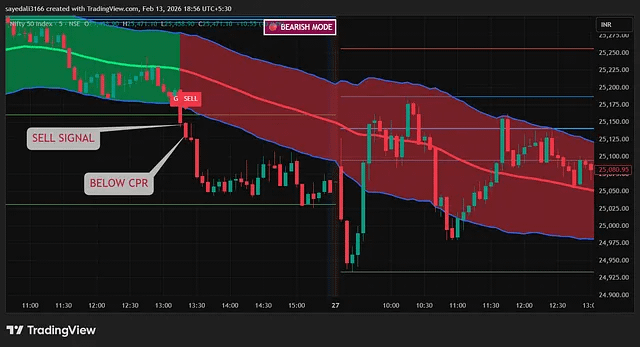
The chart shown above brings several key components together into one clear visual framework. It includes a dynamic trend ribbon that defines market direction, the Central Pivot Range for intraday structure, key support and resistance zones, and clear buy and sell markers. Instead of relying on multiple standalone tools for volatility, trend strength, and reversals, this layout integrates everything into a single, easy to read view. Let’s walk through what this actually fixes.
Problems This Setup Eliminates
Many traders consistently struggle with the same issues. They enter trades against the dominant trend. They buy near resistance levels. They sell into support zones. They exit profitable trades too quickly. They hesitate and enter after the move has already happened. This structure addresses one core challenge. It keeps you aligned with momentum instead of fighting it.
How to Apply This Setup to Your Chart
You can recreate this layout easily on TradingView or similar charting platforms.
Step 1: Open Your Chart
-Select the following.
-Asset: Nifty 50
-Timeframe: 5 minutes
This timeframe is especially effective for intraday traders.
Step 2: Add the Trend Ribbon
-Open the indicator search and look for:
-Gk trend ribbon
Apply it to the chart to begin building the setup.
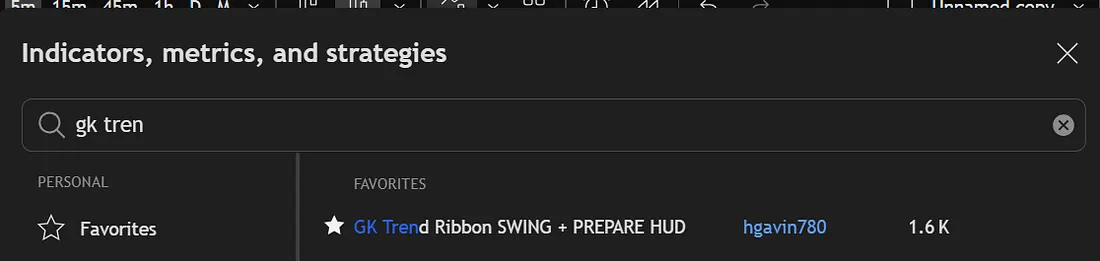
The ribbon shifts color to reflect momentum. Green signals bullish strength. Red indicates bearish pressure.
Step 3: Add the Central Pivot Range
-Open the indicator search, type CPR, and apply it to the chart.
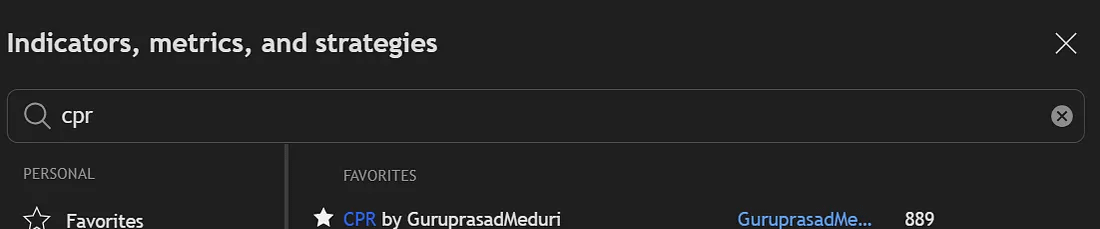
This displays the pivot point along with the upper and lower central levels. Together, these areas function as key decision zones for intraday trading.
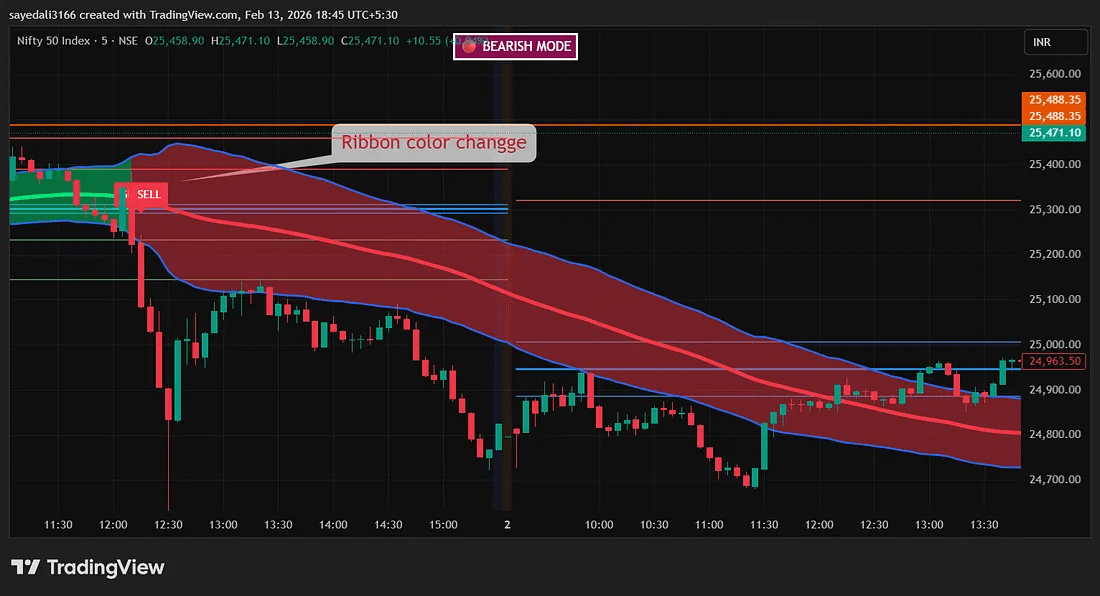
How to Read the Trend Ribbon
A green ribbon indicates a strong bullish period. A red ribbon signals a strong bearish period. A wider ribbon reflects stronger momentum. A thinner ribbon suggests the trend is weakening. Even this single visual layer makes direction much easier to read. Instead of trying to predict where price should go, you simply align with what the ribbon is showing.
Example
Let’s walk through the move in a step by step way.
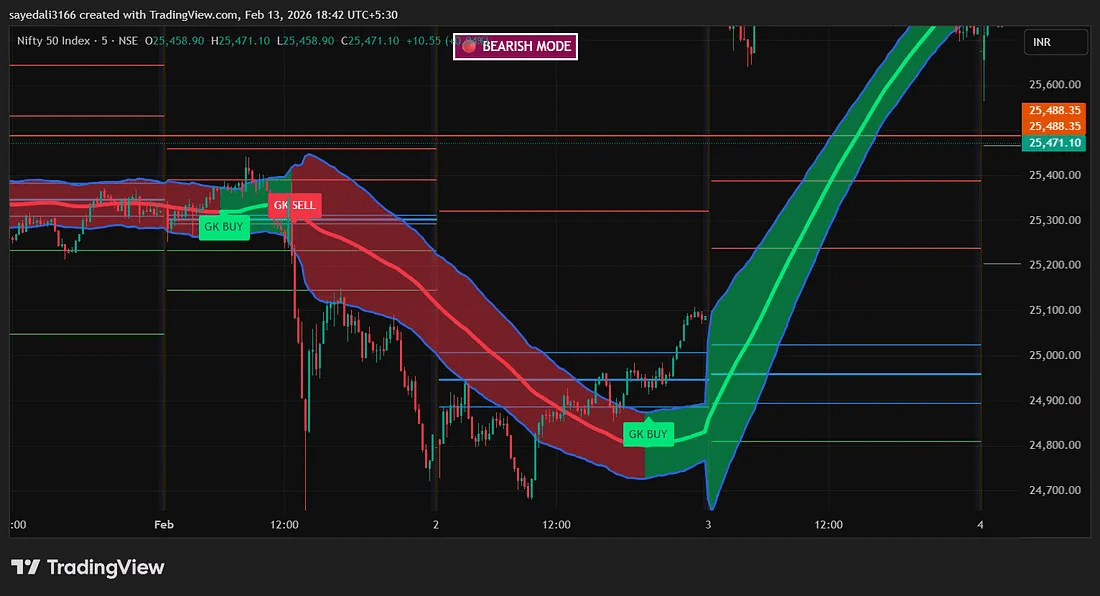
Phase 1: Bearish Leg
At the start:
The ribbon remains red. Price is trading beneath it. A sequence of lower highs is developing. This structure confirms a bearish outlook. Buying is avoided in this phase. Only short setups are considered.
Phase 2: Shift to Bullish Conditions
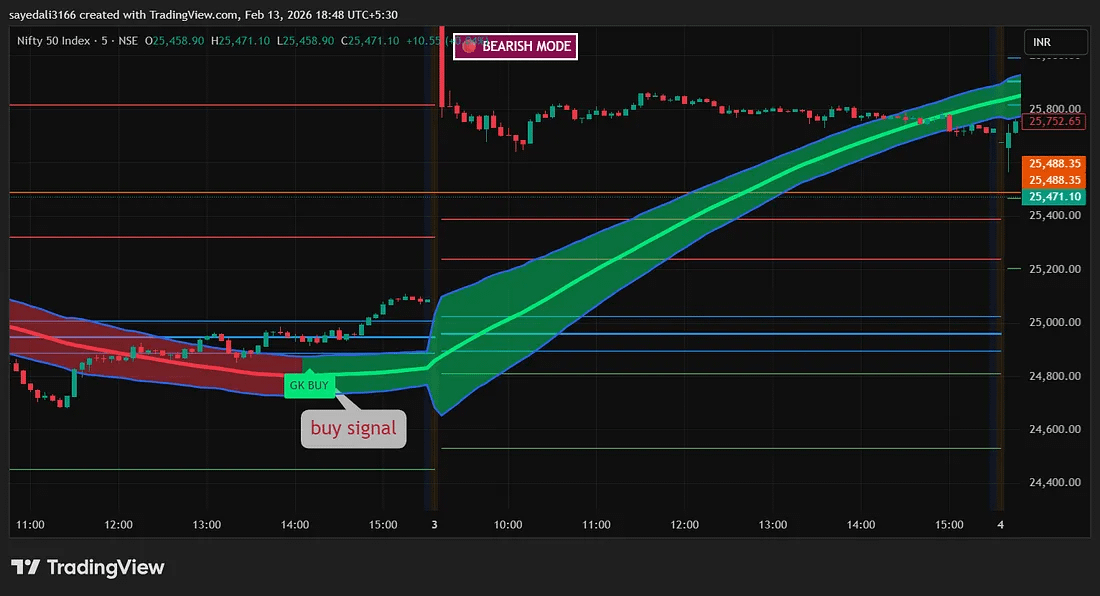
A green BUY label appears on the chart. This happens when price breaks above the ribbon, the ribbon flips from red to green, momentum begins to expand, and higher highs start forming. This combination signals a shift in market structure and highlights the zone where experienced traders typically look to enter.
After the buy signal, trend continuation becomes the focus. Price holds above the ribbon, pullbacks respect it as dynamic support, and the ribbon widens to reflect strong momentum. This phase favors staying in the trade rather than reacting emotionally to minor pullbacks.
This is also where stop loss management matters most. Instead of exiting early, stops should be trailed along the ribbon to stay aligned with the trend. Cutting trades too soon often leaves the strongest part of the move on the table.
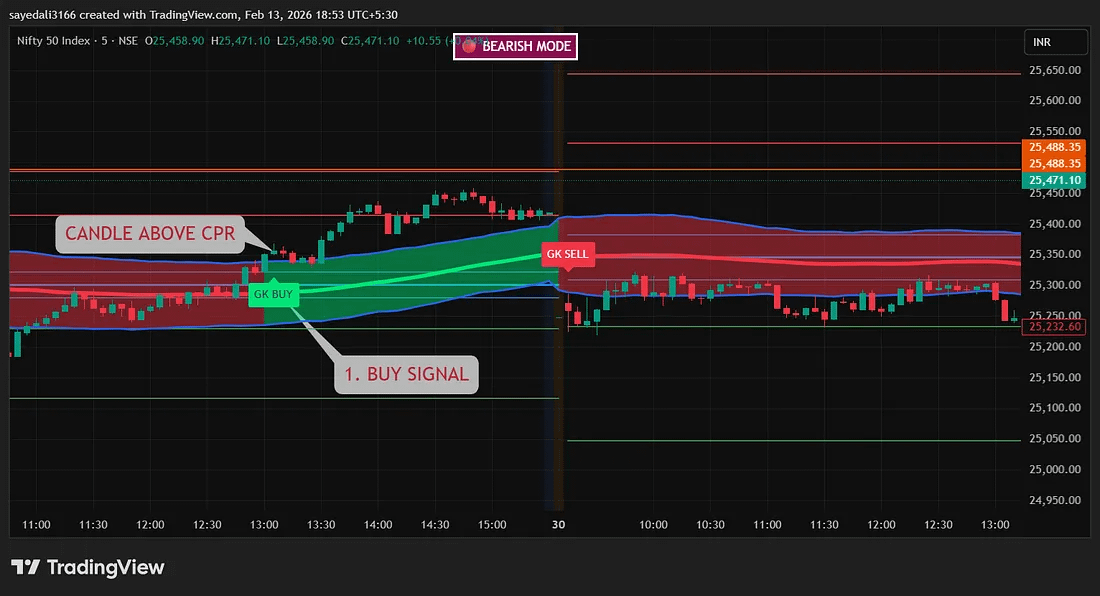
The ribbon flips to green and price closes firmly above it, with the CPR pivot sitting below current price. Breakouts are supported by rising volume, and any pullback finds support at the ribbon, confirming bullish control.
The preferred entry comes after the first retracement, when a bullish candle closes back above the ribbon. Risk is managed by placing the stop loss below the ribbon or under the most recent swing low.
Targets are set at the previous resistance area with a minimum risk to reward of 1 to 2, or the position can be managed by trailing the stop along the ribbon. Short trades are considered only when the opposite conditions are present.
When the ribbon turns red and price closes below it, bearish control is confirmed, especially if the CPR pivot sits above current price. A valid breakdown is supported by a strong bearish candle body, and any pullback that fails at the ribbon reinforces short bias. Risk is managed by placing the stop loss above the ribbon or the most recent swing high, while targets are set at prior support levels, a minimum 1 to 2 risk reward, or managed dynamically by trailing along the ribbon.
CPR plays a critical role in filtering quality trades. It helps determine whether the market is trending or stuck in consolidation, and whether a breakout has real strength. A narrow CPR often precedes an expansion move, while a wide CPR signals range bound behavior. When ribbon direction aligns with CPR structure, trade probability improves significantly. To avoid false signals, traders should avoid ribbon flips in sideways markets, never trade against the higher timeframe trend, wait for candle closes, and confirm participation through volume. Patience here directly improves consistency.
Trade execution is only part of the equation. Professional traders focus heavily on management. Once price reaches a one to one reward, stops should be moved to breakeven. Positions can then be managed by trailing below the ribbon for long trades or above it for short trades, with partial profits taken near resistance or support. Common mistakes include buying when the ribbon is red, selling into support, ignoring CPR zones, overtrading every signal, and trading during low volatility periods.
This setup works best for intraday traders, scalpers, index traders, and futures traders, but it is not designed for long term investing or signal chasing. The ribbon and CPR provide structure, not guarantees. Proper position sizing, controlled risk per trade, and emotional discipline matter more than any indicator. Clarity, not complexity, is what drives profitable trading.