through the charts, and something is genuinely confused me.
LOOK AT THIS DISCONNECT:
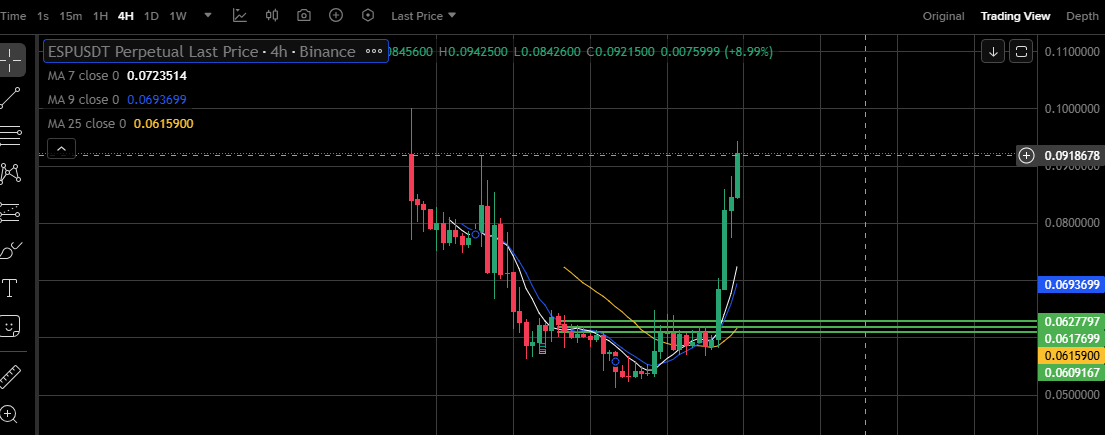
📉 The 4H Chart (Old Data):
Looking at the historical 4H, we saw:
MA7 at 0.05476
MA9 at 0.05595
MA25 at 0.06136
All sloping DOWN. The chart looked DEAD. A textbook downtrend.
📈 The CURRENT Market
Price: $0.09307 (UP 54.83% )
24H High: $0.09425
24H Low: $0.05671 now that's a MASSIVE range
Volume: 3.15 BILLION ESP traded ($250 Million USDT volume!)
THE DATA TELLS:
The price bottomed near $0.032 (according to the range) and has nearly 3x'd. The old moving averages are completely useless now—price is trading FAR above them.
THE ORDER BOOK :Right now, the bids and asks are fighting at the $0.093 level:
Bids (Buyers): A wall forming at $0.09300 (67k ESP) and $0.09307 (8.6k ESP). Bulls want to hold $0.093.
Asks (Sellers): Thin until $0.09317. If buyers push through, the next air pocket could send us to $0.094+ quickly.
Funding is NEGATIVE at -0.11213%.
this translates to : Shorts are paying longs to hold.


Anyway ESP just woke up from a deep sleep. The volume is real ($250M). The move is real.
whether the bulls can hold $0.09300 as support. If they do, the next target is the $0.10 psychological level.
did you make some on this?
#ESPUSDT #esp #StrategyBTCPurchase #PredictionMarketsCFTCBacking