
📰 Daily Market Update:
Recent on-chain metrics are flashing important signals across the crypto market.
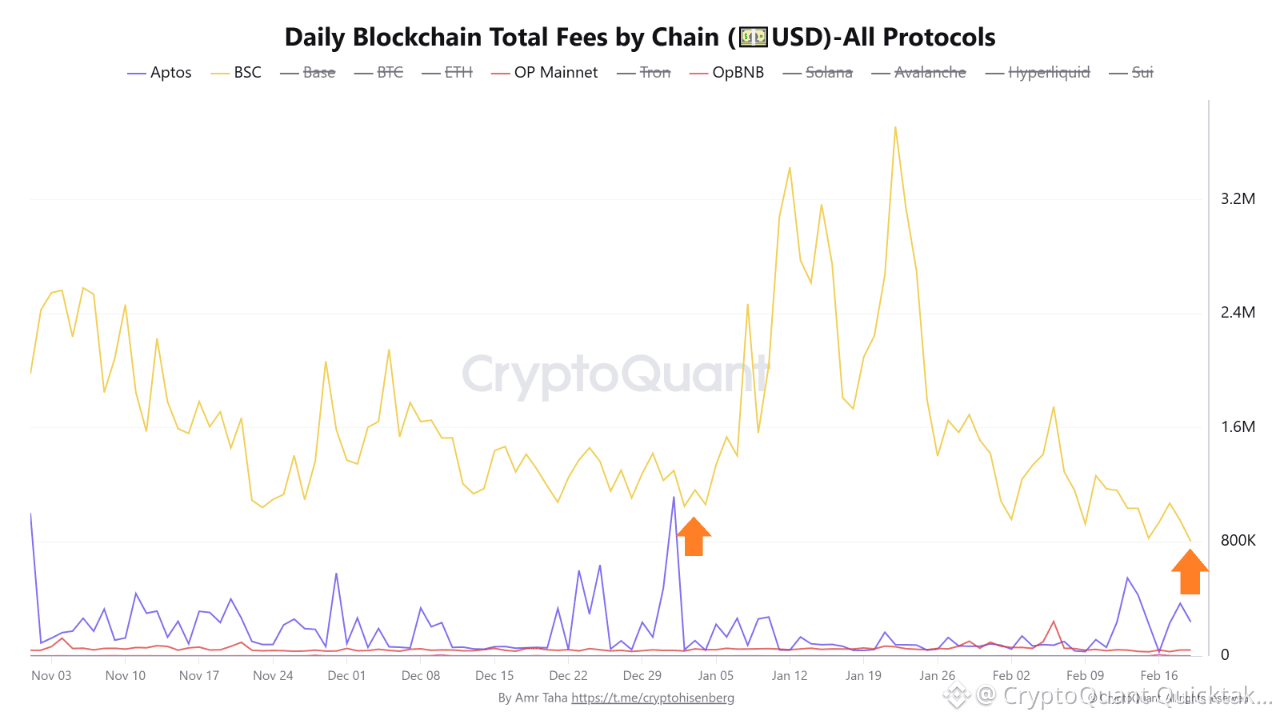
📊 Daily Blockchain Total Fees by Chain (💵USD)-All Protocols
The chart tracks the total amount of fees paid by users across 12 different blockchain networks, all denominated in US dollars.
📈 Rising fees usually signal strong demand and network congesti.
📉 Falling fees reflect weaker activity and declining interest, which often translates later into reduced exposure to crypto assets.
🔬 Key Observation
📉 A sharp decline in fees on the Binance Smart Chain, where total daily fees fell to around $800,000 by Feb 19.
📅 The last time fees dropped close to these levels was on January 2, 2026, when total BSC fees were slightly above $1M.
📈 Shortly after that period, BTC rallied more than 10% in the days following January 2.
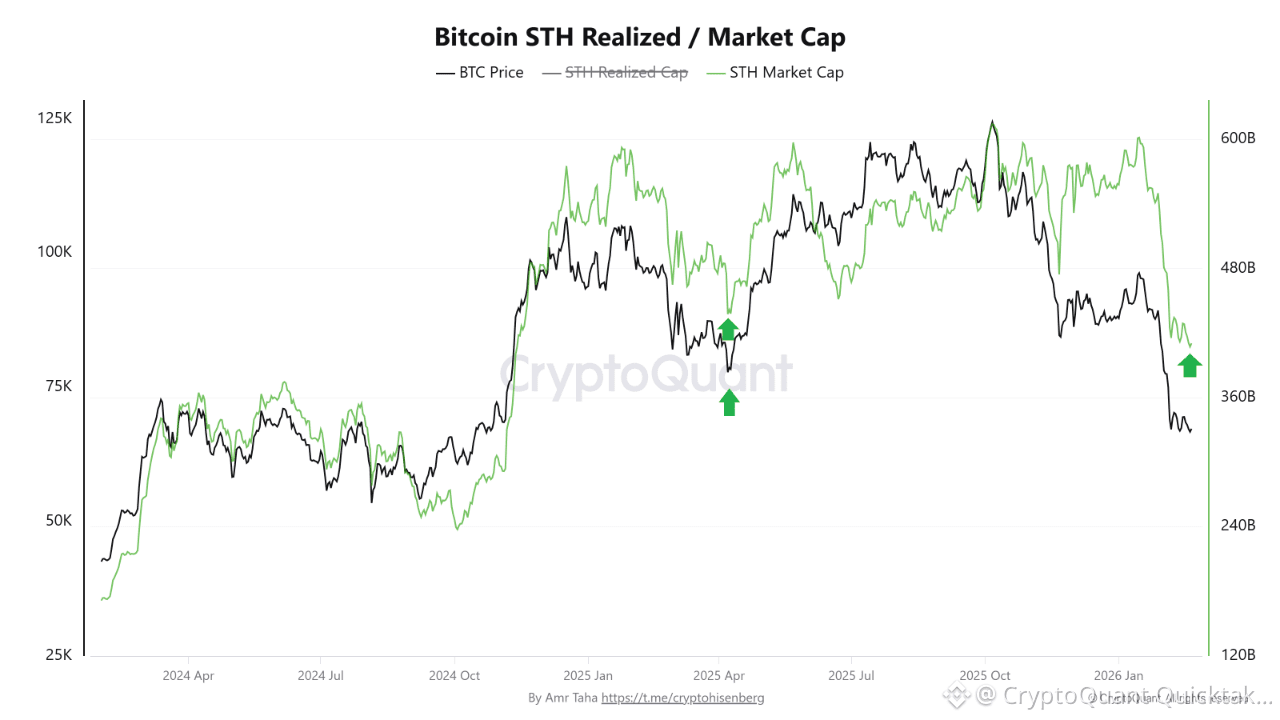
📊 Bitcoin STH Realized / Market Cap
What is STH Market Cap?
It represents the current market value of all Bitcoin held by short-term investors, calculated using the current market price.
🔬 Key Observation
📉 the chart shows a sharp drop in STH Market Cap to around $410B, breaking below the previous low of $440B recorded on April 8, 2025.
⏲️ Historically, deep drawdowns in this metric have aligned with major capitulation events, similar to April 8, which later helped BTC recover from around $78k to over $108k.
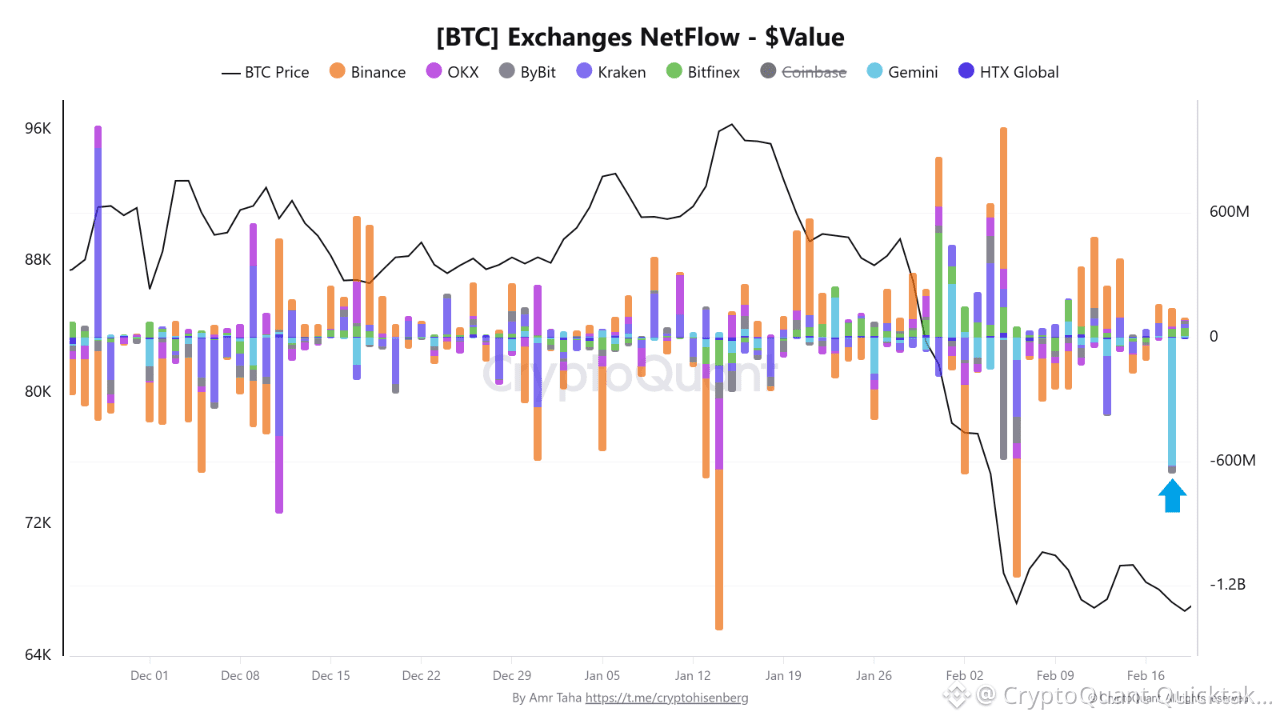
📊 [BTC] Exchanges NetFlow - $Value
The chart tracks the daily net Bitcoin flows across 8 major spot exchanges.
🔬 Key Observation
on Feb 18, the chart highlights a negative netflow of approximately $618M, coming specifically from Gemini.
⏲️ Historically, large negative netflows from spot exchanges tend to reflect whale or institutional accumulation, as coins are moved into cold storage instead of being prepared for sale.
🧠 Final Conclusion
Such behavior often suggests that current price levels are viewed as attractive long-term accumulation zones, especially when combined with declining speculative activity and STH stress
Written by Amr Taha