The cryptocurrency market in February 2026 continues to show stark contrasts. Bitcoin (BTC), Ethereum (ETH), and XRP have endured heavy selloffs, with BTC down roughly 22-45% year-to-date from its 2025 peaks above $126,000, now trading around $65,000-$70,000. ETH has slipped to $1,700-$2,000 levels, down 33-40%, while XRP hovers at $1.40-$1.55, off nearly 48%.
In contrast, Solana (SOL) has remained resilient, often posting gains like +2.58% to around $84.63, or even higher estimates near $117 in some metrics, staying green amid the turmoil.
This rotation by smart money institutional investors and whales stems from SOL's robust fundamentals, on-chain growth, and technical strength. Below, we break it down, incorporating chart analysis to highlight why SOL is attracting capital.
1. Institutional Inflows Signal Strategic Rotation
Despite the broader downturn, SOL has seen positive ETF inflows, such as +$3.08M in late January, while BTC, ETH, and XRP faced outflows of -$483M, -$230M, and -$53M respectively. Earlier data showed SOL attracting $92.9M in January, ranking second only to BTC. On-chain whale accumulation near $80 support underscores confidence. Institutions view SOL as a high-beta alternative, with ETF assets surpassing $1B. This isn't panic selling but repositioning, as "smart money doesn’t exit. It rotates.
2. On-Chain Metrics Outpace Competitors
SOL's Total Value Locked (TVL) has reached $8.2B, third behind ETH and BNB Chain, with daily active addresses and volumes at all-time highs. DEX volumes are surging, accelerating token burns and supply squeezes. SOL's TVL-to-market-cap ratio of 17.4% indicates undervaluation driven by utility. Meanwhile, ETH's gas fees spiked 300%, and XRP faces regulatory drags.
Smart money sees SOL as the asymmetric bet in 2026: scalable (100k+ TPS / sub-cent fees), utility exploding (DeFi/RWA/on-chain finance), and undervalued vs. fundamentals. While BTC/ETH/XRP reset, SOL's resilience signals the start of a rotation into execution-layer winners.
3. Chart Analysis: SOL's Technical Edge
Examining charts reveals SOL's relative strength. On the daily timeframe, SOL has held key support at $80, rebounding +2.58% while BTC consolidates in a $65,729-$71,746 range with breakdown risks.
SOL's 30-day moving average is flattening near $85, with RSI at 42-50 (neutral, not oversold like ETH's sub-40).
In comparison, ETH shows a downtrend with lower highs/lows, trading below its 21-day MA at $1.47 equivalent, and XRP exhibits a bearish structure with RSI at 37, stuck in $1.35-$1.50 consolidation.
BTC's chart mirrors stagnation, with 9-day MA flattening but medium-term bias negative.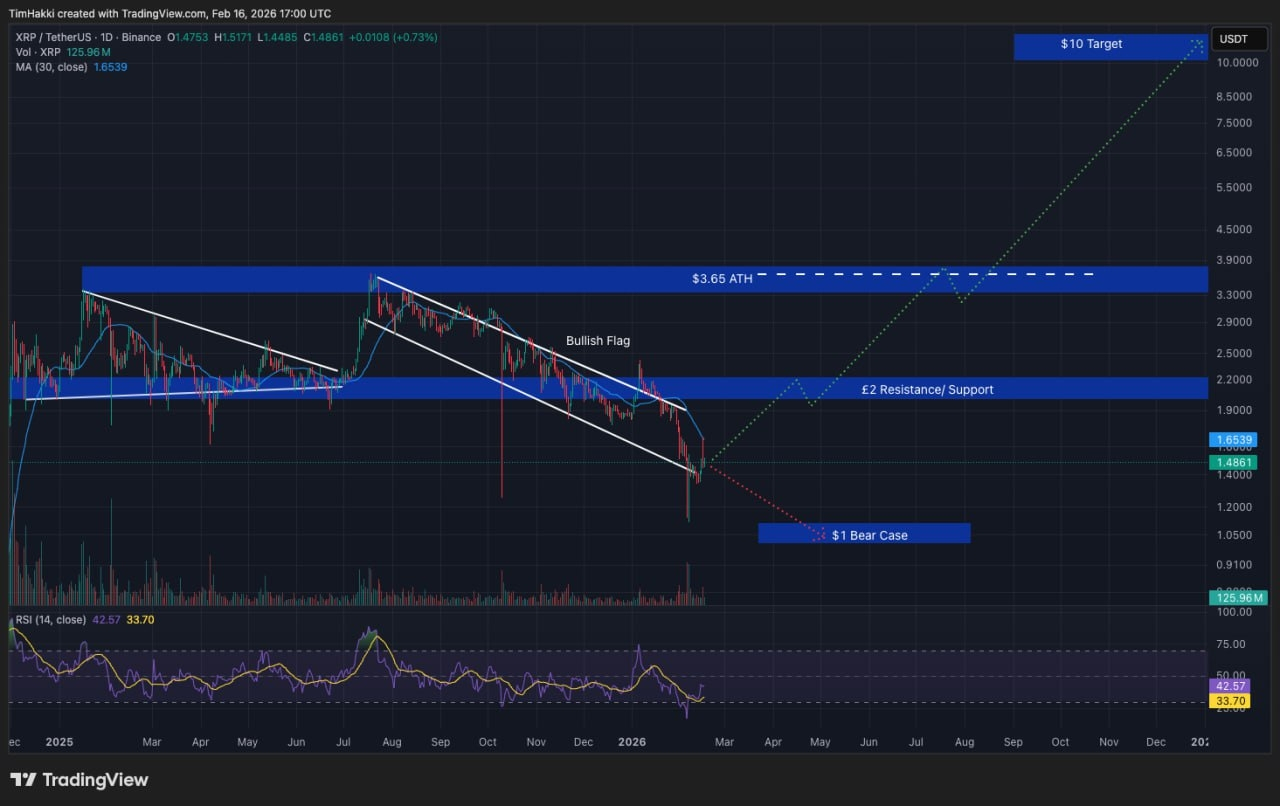
SOL's four-hour chart shows a constructive micro-structure, invalidating bearish patterns and building higher lows in high-volume zones (0.618 Fib retracement). Resistance at $100 looms, but validator health counters supply unlocks.
XRP's chart, by contrast, displays a bullish flag potential but remains in downtrend with $1.15 bear case.
ETH and BTC face similar macro pressures, with ETH undervalued but centralized. 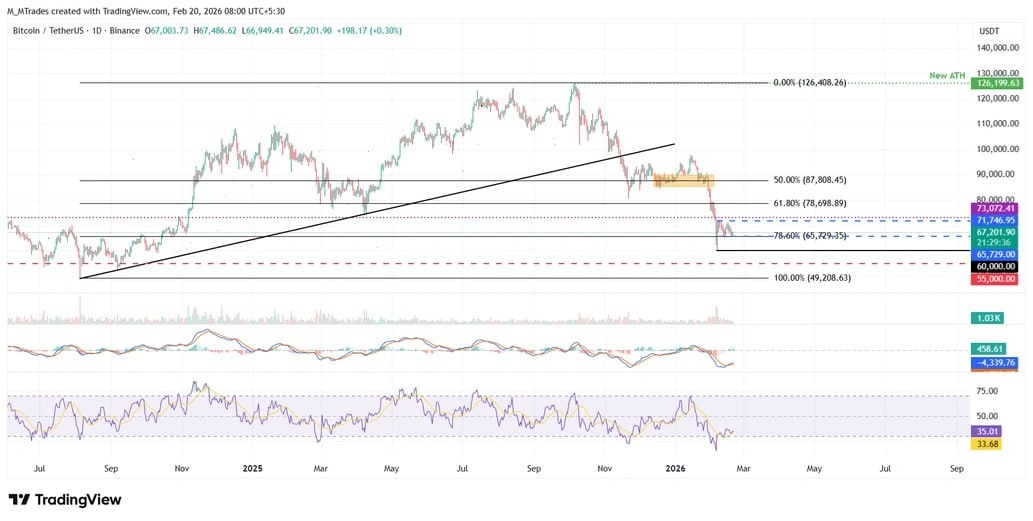
This divergence SOL green amid red signals rotation into scalable chains.
4. Upgrades and Long-Term Projections
SOL's Alpenglow upgrade enhances consensus for faster speeds, partnering with Alibaba for low-latency trading.
Analysts like Standard Chartered forecast SOL at $250 for 2026 (down from $310) but $2,000 by 2030, outpacing XRP's $2.80-$28 and ETH's $4,000-$40,000.
AI models predict SOL up 500% in bull cases vs. ETH's 480% and XRP's 200%.
Risks include $870M unlocks, but burns mitigate.
In essence, smart money rotates to SOL for its utility-driven rebound potential. Chart resilience suggests $100 by mid-2026 if support holds. DYOR amid volatility.