
14 hours ago
4
BTC REBOUND OR TRAP? The Truth About the $68K Breakout!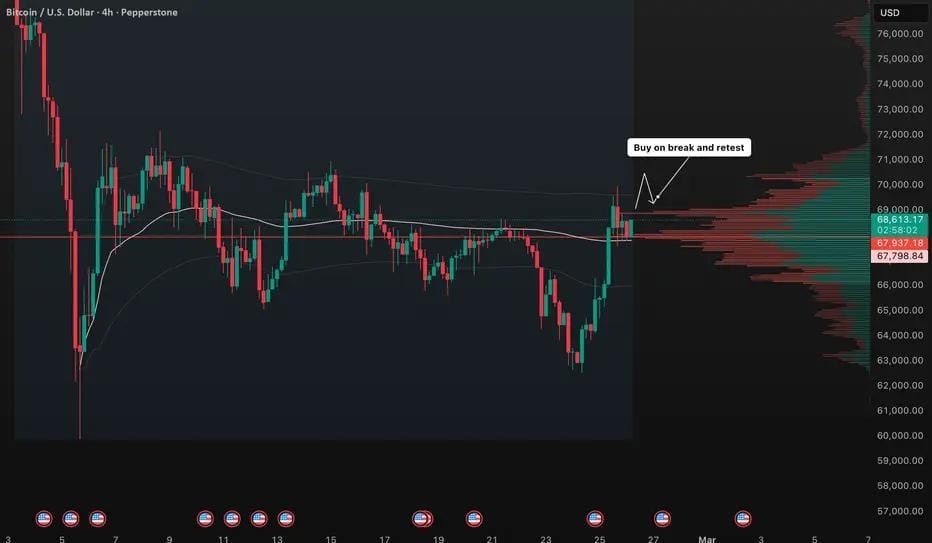
The macro narrative heading into the end of February 2026 is defined by a violent tug-of-war between a bruised "Risk-Off" regime and a burgeoning relief rally fueled by the latest State of the Union address 🏦. After a brutal month that saw Bitcoin shed nearly 24% of its value—mirroring the darkest days of the 2022 crypto winter—the tide is starting to turn as institutional dip-buying resurfaces. Interestingly, while market chatter earlier this week was submerged in "Extreme Fear" with retail sentiment calling for a sub-$60,000 collapse, the return of spot ETF inflows suggests a liquidity hunt has already cleared out the late shorts. General online communities are still leaning toward caution, fearing a "dead-cat bounce," but the underlying pulse indicates that the forced selling from miners and levered players has largely been absorbed. We are seeing a potential structural shift on the H4 timeframe as price attempts to reclaim the $68,500 handle 📈. Following a classic Wyckoffian "Spring" or liquidity sweep below the $63,000 local lows, the current markup is challenging the lower boundary of the previous consolidation range. While widespread community chatter remains skeptical of the rally's legs, the high-volume node (HVN) visible on the profile suggests we are entering a "Discovery" phase toward the upper value area. The aggressive 7% bounce on Wednesday has trapped retail bears who were positioning for a breakdown, and a successful "break and retest" of the current resistance would confirm that the Markdown phase has exhausted its momentum 💰. Key Zone: The primary focus is the Volume Profile Point of Control (POC) sitting near $68,000, which aligns with the current price action 📉. We are seeing a cluster of high-volume nodes between $67,800 and $69,000, indicating a heavy battleground for "Value." A sustained hold above the VWAP in this region would signal that the market has accepted these higher prices, shifting the bias from a bearish retreat to a bullish range expansion. We are currently trading at a pivotal inflection point, battling the gravity of the monthly downtrend while riding the momentum of a fresh risk-on rotation 🌍. I am watching for a 'run on liquidity' to sweep the late buyers near $70,000 before a potential consolidation. The market is currently testing the "Buy on break and retest" thesis marked on the chart; a failure to hold $67,700 would likely see us revisit the $64,000 liquidity pockets to satisfy the late sellers I'm seeing across various social forums 🧹. However, if the ETF tailwinds persist into the weekly close, the path of least resistance points toward the $72,000 supply zone.
by fxtraderanthony
14 hours ago
0
#AVAX/USDT : The Calm Before the Squeeze Storm
#AVAX The price is moving within a descending channel on the hourly timeframe. It has reached the lower boundary and is heading towards breaking it. A retest of this boundary is expected. The Relative Strength Index (RSI) is showing a downward trend, moving in a downtrend and likely to continue due to overbought conditions. There is a key resistance zone in green at 8. The price has bounced off this zone several times, making it a strong support level. A consolidation trend is observed above the 100-period moving average, which we are approaching. This trend supports a decline towards this level. Entry Price: 9.12 Target 1: 9.21 Target 2: 9.34 Target 3: 9.53 Stop Loss: At the resistance zone in green. Remember this simple thing: Money Management. For any questions, please leave a comment. Thank you.
by CryptoAnalystSignal
Updated 14 hours ago
1
#ENA/USDT setting up for its next leg higher.
#ENA The price is moving within a descending channel on the hourly timeframe. It has reached the lower boundary and is heading towards breaking it. A retest of this boundary is expected. The Relative Strength Index (RSI) is showing a downward trend, moving in a downtrend and likely to continue due to overbought conditions. There is a key resistance zone in green at 0.1050. The price has bounced off this zone several times, making it a strong support level. A consolidation trend is observed above the 100-period moving average, which we are approaching. This trend supports a decline towards this level. Entry Price: 0.110 First Target: 0.1126 Second Target: 0.116 Third Target: 0.120 Stop Loss: At the resistance zone in green. Remember this simple thing: Money Management. For any questions, please leave a comment. Thank you.
by CryptoAnalystSignal
Updated 14 hours ago
3
ETH/USDT
Continuation of bearish trend , formation of LH & LL
by Fahadtabassam
14 hours ago
2
SOL – Rejection Incoming at $100?
SOL is still in a correction phase, trading within a broader bearish structure. Price is now approaching a strong confluence zone: • Upper trendline resistance • The $100 round number • A marked supply zone This intersection creates a high-probability rejection area. As long as this confluence holds, the overall bias remains bearish. However, if bulls manage to break above this intersection aggressively, a shift in momentum from bearish to bullish becomes possible. ⚠️ Disclaimer: This is not financial advice. Always do your own research and manage risk properly. 📚 Stick to your trading plan regarding entries, risk, and management. Good luck! 🍀 All Strategies Are Good; If Managed Properly! ~Richard Nasr
by TheSignalyst
14 hours ago
1
0
$ETH LONG IDEA
At the moment, we have a fairly clear structure forming. A large ABC correction has been developing since September 2025. Currently, we are at a point with a high probability of either a bounce or even a solid local reversal. Looking at the structure from 2026 onward, we can see a five-wave pattern of a lower degree. We are now in the fifth wave. The fourth wave has been conditionally completed, and the move toward the fifth has already begun. What remains is to update the third subwave high and complete the formation of the fifth wave. After that, the probability of a bounce increases again. This level aligns with several confluences: a support block and a larger ABC correction that fits within the D 5 3 range. The five-wave structure is also completing in the same area where both the block and the ABC correction converge.
by MyTechNAz
Updated 14 hours ago
4
#DOT/USDT Ready to go higher
#DOT The price is moving within a descending channel on the hourly timeframe. It has reached the lower boundary and is poised to bounce upwards. A retest of this boundary is expected to strengthen the rebound. The Relative Strength Index (RSI) is showing a downward trend and is expected to break above it. There is a key support zone in green at 1.22. The price has bounced from this zone several times, making it a strong support level. A consolidation trend is observed above the 100-period moving average, which we are approaching. This supports the short-term uptrend. Entry Price: 1.25 Target 1: 1.32 Target 2: 1.41 Target 3: 1.52 Stop Loss: At the resistance zone in green. Remember this simple thing: Money management. For any questions, please leave a comment. Thank you.
by CryptoAnalystSignal
Updated 14 hours ago
3
#VET/USDT Traders watch VeChain 10% upside
#VET The price is moving within a descending channel on the hourly timeframe. It has reached the lower boundary and is poised to bounce upwards. A retest of this boundary is expected to strengthen the rebound. The Relative Strength Index (RSI) is showing a downward trend and is expected to break above it. There is a key support zone in green at 0.00705. The price has bounced from this zone several times, making it a strong support level. A consolidation trend is observed above the 100-period moving average, which we are approaching. This supports the short-term uptrend. Entry Price: 0.00725 First Target: 0.00740 Second Target: 0.00760 Third Target: 0.00784 Stop Loss: At the resistance zone in green. Remember this simple thing: Money Management. For any questions, please leave a comment. Thank you.
by CryptoAnalystSignal
Updated 14 hours ago
0
BTC/USDT analysis
Continuation of bearish trend , formation of series of LHs and LLs
by Fahadtabassam
14 hours ago
1
Show more publications
English
Select market data provided by ICE Data Services.
Select reference data provided by FactSet. Copyright © 2026 FactSet Research Systems Inc.
Copyright © 2026, American Bankers Association. CUSIP Database provided by FactSet Research Systems Inc. All rights reserved.
SEC fillings and other documents provided by Quartr.
© 2026 TradingView, Inc.
More than a product
Supercharts
Screeners
Stocks
ETFs
Bonds
Crypto coins
CEX pairs
DEX pairs
Pine
Heatmaps
Stocks
ETFs
Crypto coins
Calendars
Economic
Earnings
Dividends
More products
Yield Curves
Options
Macro Maps
News Flow
Pine Script®
Apps
Mobile
Desktop
Community
Social network
Wall of Love
Refer a friend
House Rules
Moderators
Ideas
Trading
Education
Editors' picks
Pine Script
Indicators & strategies
Wizards
Freelancers
Tools & subscriptions
Features
Pricing
Market data
Gift plans
Trading
Overview
Top brokers
Brokers comparison
Special offers
CME Group futures
Eurex futures
US stocks bundle
About company
Who we are
Space mission
Blog
Careers
Media kit
Merch
TradingView store
Tarot cards for traders
The C63 TradeTime
Policies & security
Terms of Use
Disclaimer
Privacy Policy
Cookies Policy
Accessibility Statement
Security tips
Bug Bounty program
Status page
Business solutions
Widgets
Charting libraries
Lightweight Charts™
Advanced Charts
Trading Platform
Growth opportunities
Advertising
Brokerage integration
Partner program
Education program
Close
14 hours ago
BTC REBOUND OR TRAP? The Truth About the $68K Breakout!
0
The macro narrative heading into the end of February 2026 is defined by a violent tug-of-war between a bruised "Risk-Off" regime and a burgeoning relief rally fueled by the latest State of the Union address 🏦. After a brutal month that saw Bitcoin shed nearly 24% of its value—mirroring the darkest days of the 2022 crypto winter—the tide is starting to turn as institutional dip-buying resurfaces. Interestingly, while market chatter earlier this week was submerged in "Extreme Fear" with retail sentiment calling for a sub-$60,000 collapse, the return of spot ETF inflows suggests a liquidity hunt has already cleared out the late shorts. General online communities are still leaning toward caution, fearing a "dead-cat bounce," but the underlying pulse indicates that the forced selling from miners and levered players has largely been absorbed.
We are seeing a potential structural shift on the H4 timeframe as price attempts to reclaim the $68,500 handle 📈. Following a classic Wyckoffian "Spring" or liquidity sweep below the $63,000 local lows, the current markup is challenging the lower boundary of the previous consolidation range. While widespread community chatter remains skeptical of the rally's legs, the high-volume node (HVN) visible on the profile suggests we are entering a "Discovery" phase toward the upper value area. The aggressive 7% bounce on Wednesday has trapped retail bears who were positioning for a breakdown, and a successful "break and retest" of the current resistance would confirm that the Markdown phase has exhausted its momentum 💰.
Key Zone: The primary focus is the Volume Profile Point of Control (POC) sitting near $68,000, which aligns with the current price action 📉. We are seeing a cluster of high-volume nodes between $67,800 and $69,000, indicating a heavy battleground for "Value." A sustained hold above the VWAP in this region would signal that the market has accepted these higher prices, shifting the bias from a bearish retreat to a bullish range expansion.
We are currently trading at a pivotal inflection point, battling the gravity of the monthly downtrend while riding the momentum of a fresh risk-on rotation 🌍. I am watching for a 'run on liquidity' to sweep the late buyers near $70,000 before a potential consolidation. The market is currently testing the "Buy on break and retest" thesis marked on the chart; a failure to hold $67,700 would likely see us revisit the $64,000 liquidity pockets to satisfy the late sellers I'm seeing across various social forums 🧹. However, if the ETF tailwinds persist into the weekly close, the path of least resistance points toward the $72,000 supply zone
Not financial advice