COI NAME : $YGG
SIGNAL TYPE : LONG
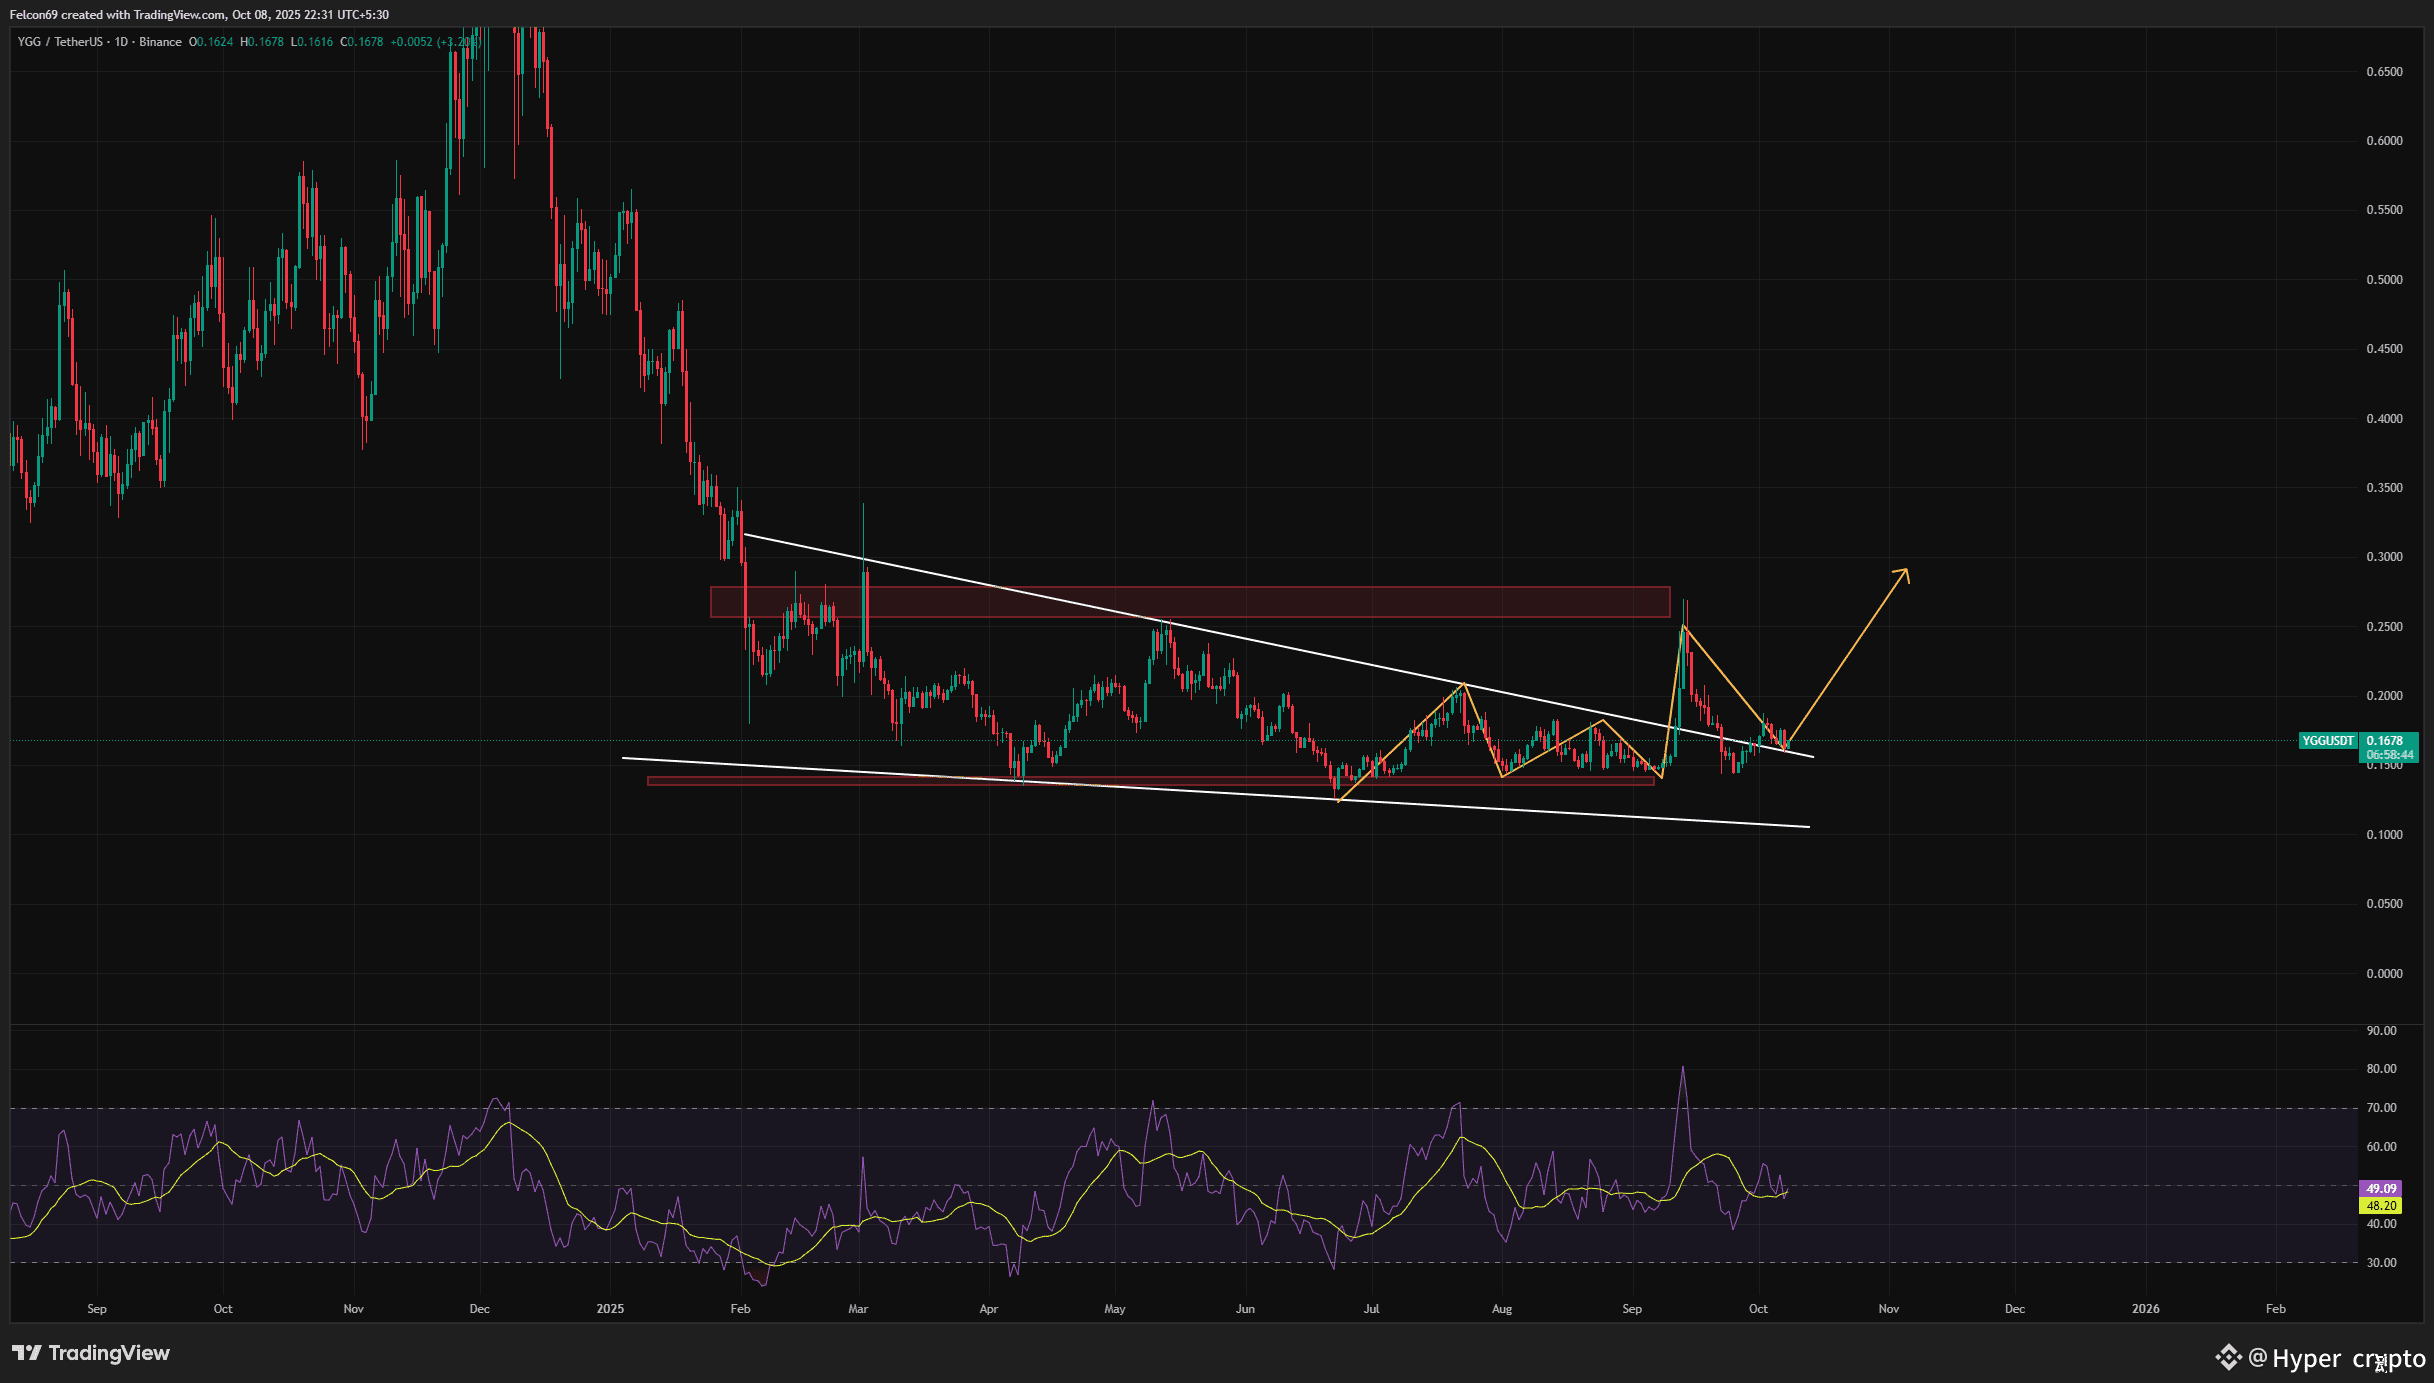
I can see YGG 1d chart showing a falling wedge pattern. price has been compressing between lower highs and lower lows inside the wedge 📉, indicating sellers are losing strength. The RSI indicator 📉 is sitting around 48, showing neutral momentum ⚖️ but hinting at possible bullish pressure building up 💪.If YGG breaks above the upper wedge trendline 🔓 with volume 📈, it could trigger a strong rally 🐂.
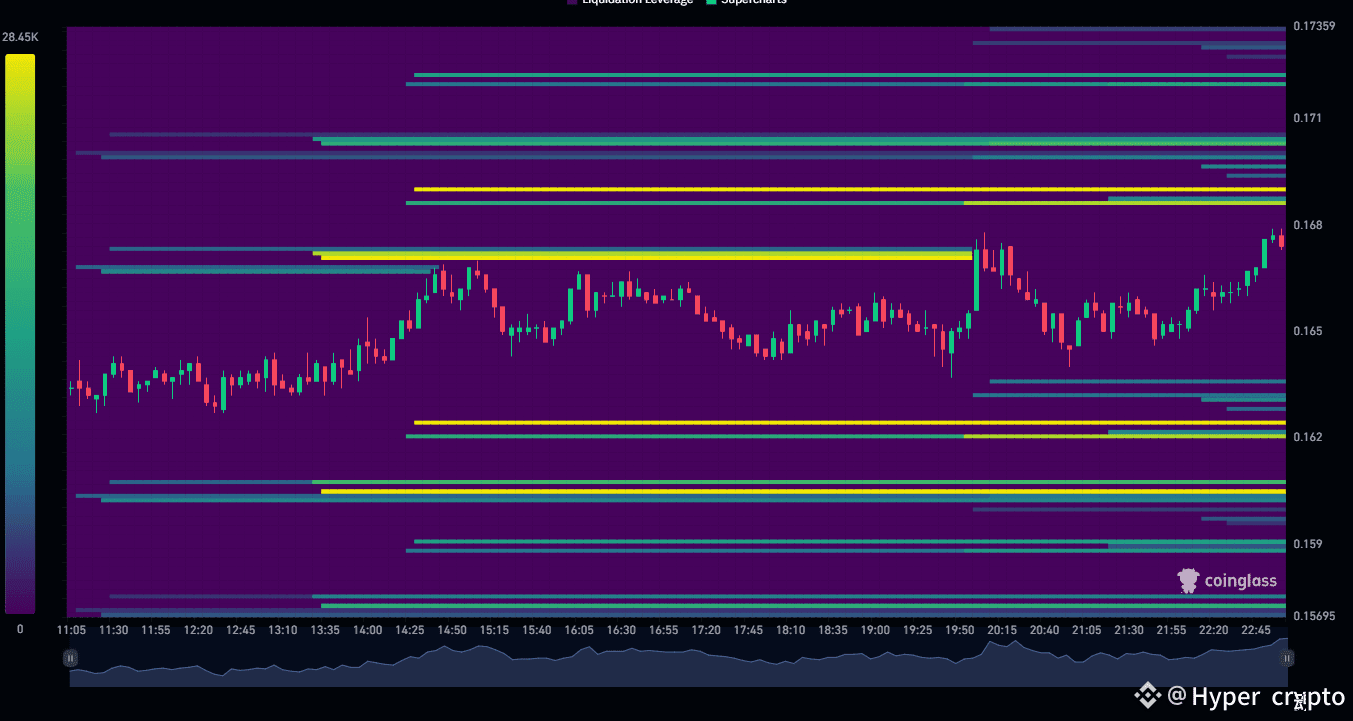
I can see on YGG liquidation heatmap yellow zones 🟡 represent high liquidity or heavy liquidation clusters, meaning many stop losses or liquidation levels are placed there.Currently, price action is around $0.168 💰 and moving upward.
ENTRY PRICE : 0.1615
TP 1 : 0.2235
TP 2: 0.2884
SL : 0.1406
For more details, simply click on my profile & check my bio.
This signal is for spot trading only. If you're interested in future signals, join my live Binance session.
Simply click on my profile to join! #hypercrypto18 #YGG你上车了么?