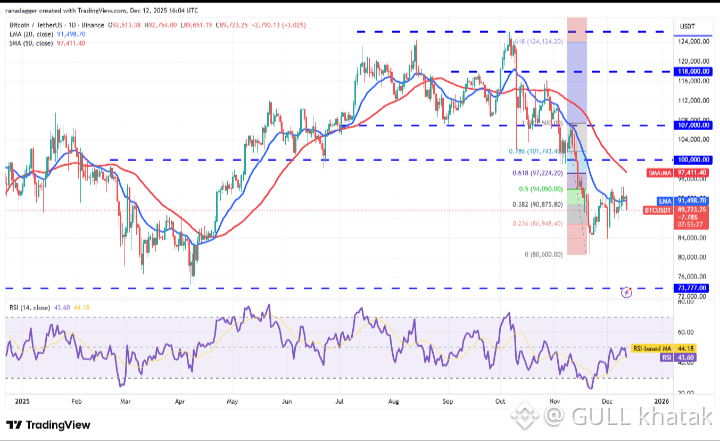
📊 $BTC — Bitcoin
Trend: Recently the price has been moving sideways with resistance around higher levels and support lower, indicating short‑term uncertainty but still strong long‑term interest. Analysts often watch levels like support near important moving averages and psychological round numbers.
🔹 Price trend example chart shown above — BTC price moves up and down with key zones shown.
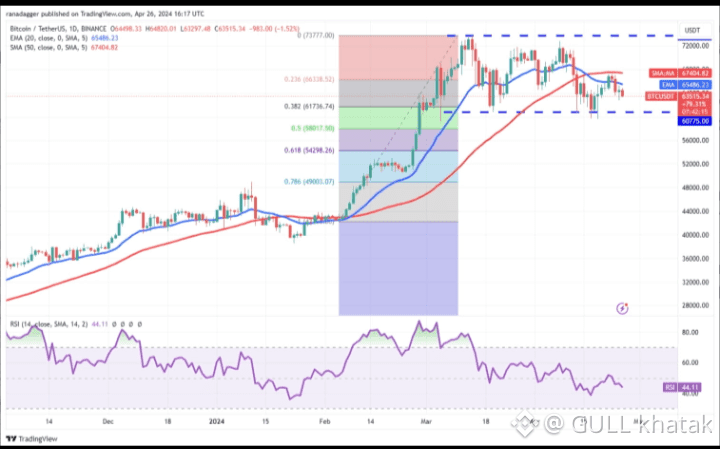
📊 $ETH — Ethereum
Trend: Ethereum has shown fluctuation within a range, sometimes bouncing between support and resistance. A breakout above key resistance could signal stronger rally potential.
🔹 ETH chart example — shows historical movement and RSI (momentum).
📊 $BNB — Binance Coin
Trend: BNB’s price often moves with broader crypto trends but can also show strength in periods of altcoin rallies. Recent technical setups hint at possible resistance and support levels traders watch.
🔹 BNB view example — snapshot within the market heatmap environment.
💡 Live Price Info (Approximate Conversions Today)
These outlines help you compare the prices:
• 1 BTC ≈ 29 ETH right now — meaning Bitcoin is worth about 29 Ethereum units.
• 1 BTC ≈ 102 BNB — Bitcoin price in Binance Coin.
• 1 ETH ≈ 3.4 BNB — Ethereum price in BNB.
CoinMarketCap
CoinGecko
CoinMarketCap
(Actual fiat prices like USD, INR, Euro, etc. are continuously updating on exchanges and platforms.)
Next 24 hour results
BTC, ETH, and BNB are more likely to stay sideways or slightly down in the next 24 hours rather than strongly up, unless market demand suddenly increases.
cointist.net +1