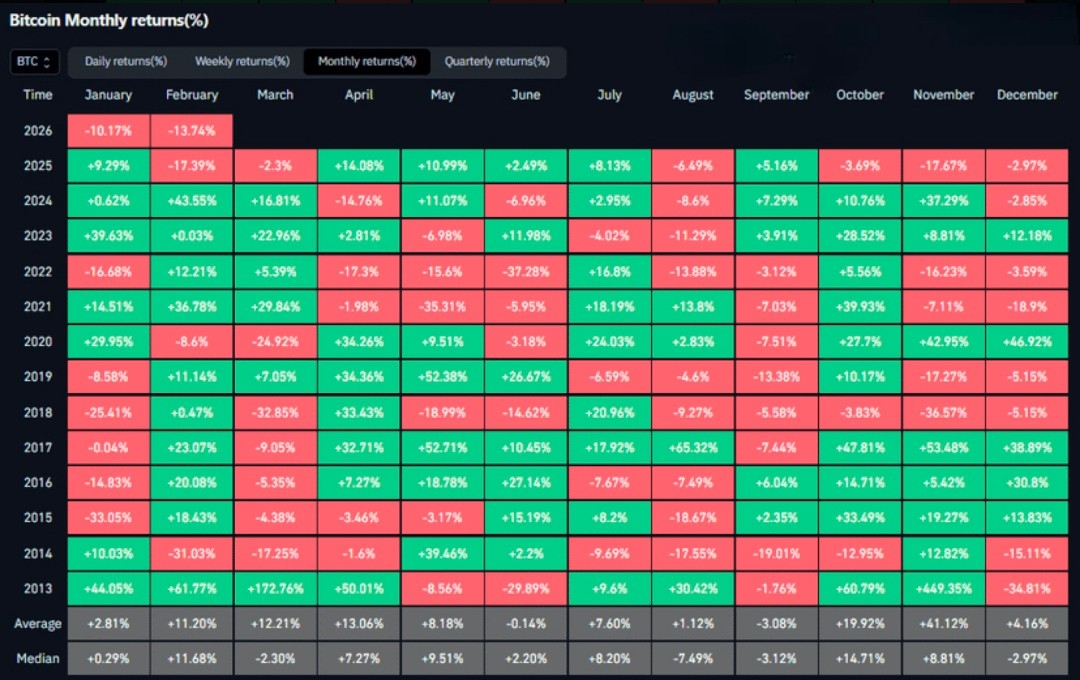
Bitcoin is approaching a macro statistic we haven’t seen since 2018.
If this month closes red, $BTC will print its longest streak of consecutive monthly declines in seven years. That’s not just a headline number — that’s higher-timeframe momentum compression.
On the monthly chart, streaks like this rarely happen in random conditions. They usually appear when:
• Liquidity is tight
• Sentiment is damaged
• Long-term holders feel pressure
• Short-term traders are already exhausted
Extended red sequences reflect structural stress. Capital rotates out. Conviction weakens. Volatility begins to compress after repeated downside.
But here’s what history shows:
When downside becomes repetitive, reaction energy builds.
Markets don’t trend linearly forever. Persistent monthly declines often push positioning to an extreme. And extremes are where inflection potential increases — not because price “must” reverse, but because risk becomes more asymmetrical.
2018 taught that prolonged weakness can precede a major reset phase.
The key isn’t just whether February closes red.
The real signal will be:
• Does downside momentum accelerate after the close?
• Or does volatility contract and absorption increase?
If breakdown continuation follows, the macro trend remains dominant.
If compression and higher-low structure begin forming, it signals transition — not euphoria, but stabilization.
Long monthly streaks don’t guarantee reversals.
They signal that the market is approaching a decision zone.
Pressure builds.
Liquidity thins.
Positioning stretches.
What happens next will define whether this is structural continuation… or late-stage exhaustion.
#BTC #bitcoin #cryptouniverseofficial