SUI has captured trader attention as recent technical divergences clash with optimistic price forecasts, trading near $1.65 in a market where Bitcoin's rebound and ETF speculation fuel altcoin rotations. This analysis dissects the attached 4-hour chart, integrating the three latest news headlines to outline probabilistic scenarios, highlighting how bullish momentum could build or falter against fragile structure.
Market Snapshot:
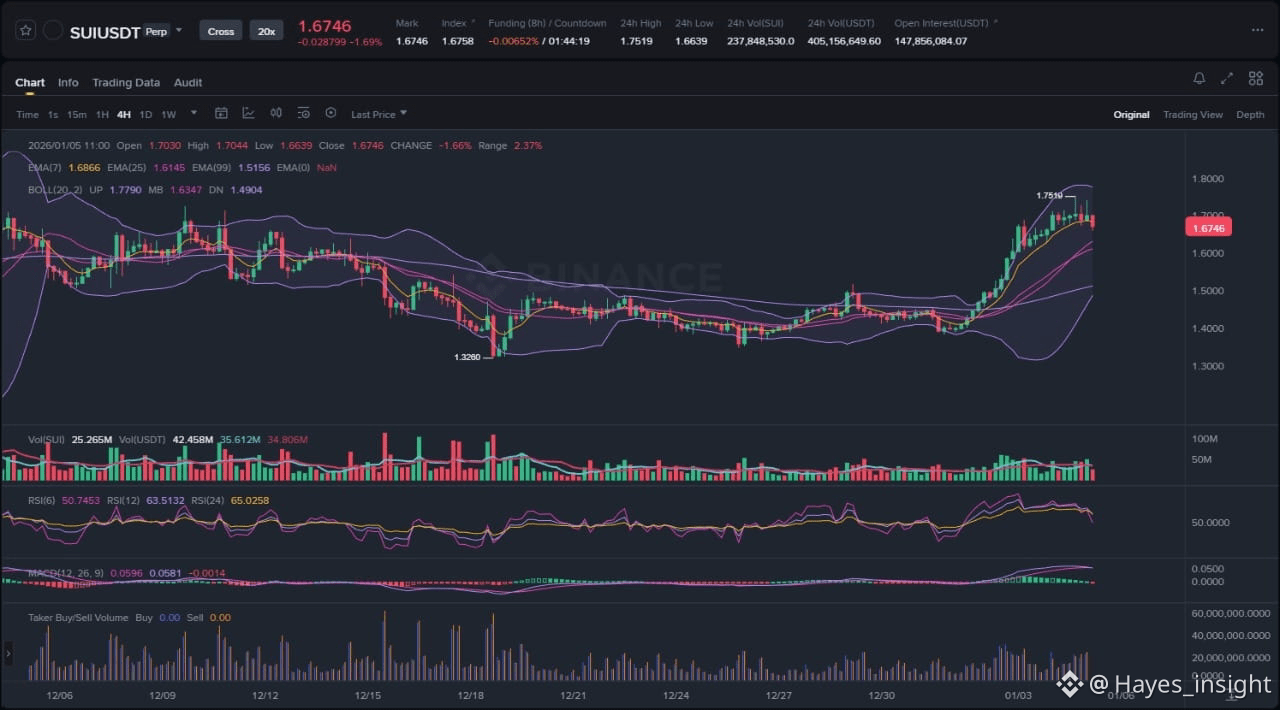
The SUI/USDT pair currently hovers around the $1.65 level on the 4-hour timeframe, encapsulating a corrective pullback within a broader uptrend that peaked near $1.74 earlier in the session. Volume profiles reveal thinning participation during the descent, with the price respecting dynamic support from the rising 50-period EMA, now acting as a liquidity pocket. Recent price action shows a rejection from local swing highs around $1.74, followed by consolidation above the prior swing low at $1.60, suggesting accumulation rather than outright distribution. Volatility has contracted post-impulsive downside, as measured by the Bollinger Bands squeezing inward, setting the stage for potential expansion. Overall market context includes Bitcoin stabilizing above $95,000, which often precedes altcoin mean reversion plays like SUI.
Chart Read:
The current structure reflects a range-bound consolidation attempt following a bearish impulsive move from the $1.74 swing high, with price now testing the lower boundary near $1.60-$1.65. Observable elements include a clear MACD bullish divergence—where price etched lower lows but the histogram formed higher lows—coupled with an RSI rebound from oversold territory below 30, and a rejection wick at the recent swing low indicating buyer defense. The Ichimoku cloud provides additional confluence, with price above the lagging span but below the conversion line, signaling neutral-to-bullish equilibrium. My main bias leans bullish, driven by the MACD reversal signal amid declining volume on downside, which points to weakening sellers and potential for mean reversion toward range highs. However, the fragile weekly structure noted in news underscores caution, as a failure here could trap early bulls in a liquidity sweep.
News Drivers:
The three latest headlines converge on two primary themes, both leaning bullish despite underlying fragility. First, technical price predictions dominate, with two reports (Blockchain News, Jan 4 and Jan 3) forecasting a $1.70-$2.10 recovery in 4-6 weeks, anchored by MACD bullish divergence countering bearish token unlock pressures—this is unequivocally bullish, aligning seamlessly with the chart's oscillator signals and suggesting building momentum. Second, macro-driven optimism emerges from AMBCrypto's analysis (Jan 4), attributing recent lifts to ETF speculation and Bitcoin's bounce, though it flags weekly structure fragility—mixed but net bullish, as broader market tailwinds could catalyze SUI's breakout. No bearish conflicts arise; instead, news reinforces the chart's bullish bias without signs of distribution or sell-the-news dynamics, potentially priming for rotation inflows.
Scenario Breakdown:
For bullish continuation, SUI must first close above the $1.74 local swing high on elevated volume, confirming breakout from consolidation and targeting liquidity above recent highs toward $2.00+ extensions. This would validate MACD momentum, with price ideally sweeping buy-side liquidity pockets before mean reversion higher, supported by RSI holding above 50. Accompanying this, a volume spike on the upside—doubling current 4-hour averages—would signal conviction from institutions rotating out of Bitcoin.
In the alternative invalidation scenario, a breakdown below the $1.60 swing low would negate the bullish thesis, potentially accelerating toward the 200-period EMA near $1.50 or deeper range lows, manifesting as a fakeout liquidity grab. This bearish path activates if sellers defend the $1.65 pivot with increasing volume, flipping MACD negative and trapping longs in a distribution phase. Fragile weekly structure amplifies this risk, where token unlocks could exacerbate downside if macro sentiment sours.
Layered probabilities favor the bullish continuation at 60-65%, given news-chart alignment, but invalidation remains a 35% tail risk tied to volume failure.
What to Watch Next:
Monitor volume behavior at the $1.65 pivot—sustained buying above average signals continuation, while fading volume warns of fakeout. Track price reaction at the $1.74 swing high for rejection or absorption, as a clean break higher confirms momentum. Watch MACD histogram expansion alongside RSI divergence for momentum confirmation, ignoring noise below oversold levels.
Risk Note:
While technicals and news suggest upside potential, weekly fragility and token unlock overhangs introduce volatility risks, where liquidity sweeps could precede true directional moves—probabilistic edges require multi-timeframe confirmation.
SUI's path hinges on reclaiming highs amid bullish signals, warranting vigilant monitoring.
#SUI #CryptoAnalysis #AltcoinOutlook $SUI