ChainOpera AI (COAI) has been a rollercoaster in the crypto markets, plunging nearly 84% from its October 24 peak to around $4.10, with a further 35% drop in the last 24 hours alone. As a senior analyst on Binance Square, I examine this token's price action through the lens of technical indicators and the latest news digest, highlighting the tension between fragile recoveries and bearish pressures. While the chart suggests possible mean reversion opportunities near key support, conflicting sentiments from recent headlines underscore the high-risk nature of this setup, where liquidity pockets at $5–$6 could either fuel a short-term upside or trap bulls in a distribution phase.
Trading Plan:
- Entry: $4.10
- Target 1: $5.50
- Target 2: $7.20
- Stop Loss: $3.80
Market Snapshot:
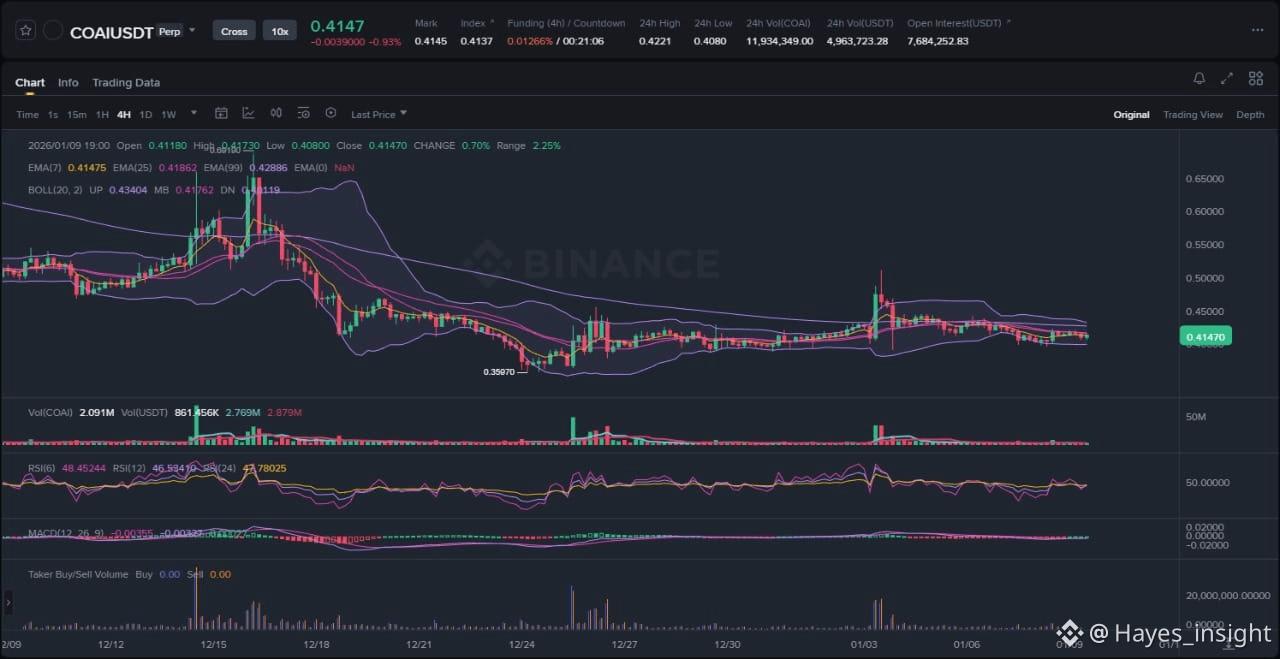
The broader crypto market remains in a consolidation phase amid macroeconomic uncertainties, with Bitcoin hovering around $60,000 and altcoins like COAI experiencing amplified volatility. COAI, tied to the ChainOpera AI ecosystem focused on decentralized AI applications, has underperformed relative to major indices, dropping over 90% from mid-October highs. This snapshot captures a token grappling with post-hype correction, where trading volume has contracted to $4 million levels, signaling reduced participation but potential for mean reversion if sentiment shifts. The attached chart, spanning recent sessions on a 1-hour timeframe, illustrates this dynamic: price candles show a sharp impulsive downside move from the $19 area, followed by a tentative consolidation near $4.10. Exponential Moving Averages (EMAs) paint a bearish picture, with the 7-period EMA sloping downward and crossing below the 25-period EMA, while the 99-period EMA acts as a distant overhead resistance around $8. Bollinger Bands have expanded dramatically, indicating heightened volatility, with price hugging the lower band, which often precedes either a squeeze or further breakdown. Observable elements include a clear rejection at the recent swing high of $19 on October 24, a local swing low formation at $4.10, and ongoing consolidation that hints at a range-bound structure rather than a confirmed downtrend continuation. This range, roughly between $4 and $6, reflects indecision after the crash, with no immediate breakout attempt visible yet.
Chart Read:
Delving deeper into the price action, COAI exhibits a corrective downtrend following an explosive rally earlier in October, characterized by a series of lower highs and lower lows since the $19 peak. The structure is predominantly bearish, with the price trapped in a descending channel bounded by the upper trendline near $6 and the lower near $4, suggesting a range within the broader downtrend. Key observable elements from the chart include the impulsive red candles driving the 84% crash, a brief consolidation phase post-drop with doji-like indecision candles, and a volatility expansion as Bollinger Bands widen to their broadest in weeks, underscoring the selling climax. Regarding EMAs, the 7 EMA at approximately $4.50 is curling downward, confirming short-term bearish momentum, while the 25 EMA around $5.80 serves as immediate resistance; the 99 EMA further up at $8.20 reinforces the longer-term downtrend, as price remains well below it. Bollinger Bands support this view, with the middle band (20-period SMA) declining and price testing the lower band at $4.10, a classic oversold condition that could invite buyers if volume picks up. Turning to momentum indicators, the RSI (14-period) at the $4.10 level sits at 28, deep in oversold territory, which aligns with the price action by signaling potential exhaustion of sellers and a high-probability bounce toward mean reversion. The MACD histogram shows contracting negative bars below the zero line, with the signal line crossover hinting at waning downward momentum— a divergence that supports the chart's suggestion of a possible reversal if price holds above $4. This $4.10 zone emerges as a high-probability entry area due to its confluence as a multi-timeframe support: it aligns with the lower Bollinger Band, the 99 EMA's projected extension, and historical liquidity pockets where prior dips found buyers, reducing the risk of immediate further downside while offering asymmetric reward potential toward the range top at $6.
News Drivers:
The latest three news items on COAI reveal a mixed sentiment landscape, which I consolidate into two primary themes: price volatility and recovery fragility (project-specific), and liquidity dynamics amid market tests (exchange/market). The first theme, centered on price volatility and recovery fragility, draws from two headlines and leans bearish overall for COAI. The October 28 AMBCrypto piece highlights a 31% drop, noting strong liquidity at $5–$6 but lower $4 volume, implying a key test ahead that could pressure the token further if support fails—bearish due to the emphasized downside risk. Similarly, the October 24 BeInCrypto article warns of bearish metrics threatening a bullish setup, with COAI rebounding above $19 after a 90% drop but appearing fragile, raising the specter of a 50% dip; this negative tone underscores vulnerability in the recovery, labeling the theme bearish. Contrasting this, the October 28 BeInCrypto positive analysis hints at a +100% rally potential after the 84% crash to $4.10, with a 35% 24-hour drop, suggesting oversold conditions could spark upside—bullish for short-term traders eyeing mean reversion. The second theme, liquidity dynamics, is mixed: the AMBCrypto mention of robust liquidity at $5–$6 points to potential short-term upside despite volume contraction, offering a bullish counterpoint to the bearish volatility narrative, while the overall news lacks exchange or regulatory angles, keeping it project-focused. Notably, the news sentiment conflicts with the chart's oversold signals; while positive rally hints align with RSI/MACD exhaustion, the bearish fragility warnings suggest a possible distribution phase or sell-the-news event, where good oversold narratives fail to halt the downtrend, potentially grabbing liquidity below $4 before any true reversal.
Scenarios:
For continuation of the potential upside scenario, COAI price must first stabilize above the $4.10 support, forming higher lows within the current range and breaking above the 25 EMA at $5.80 with increasing volume to confirm bullish momentum. This would involve a rejection of the lower Bollinger Band, pushing toward the range top near $6, where liquidity pockets could absorb selling and propel a measured move extension to prior swing highs around $7–$8, aligning with the +100% rally hinted in news. Momentum confirmation via RSI climbing above 50 and MACD histogram flipping positive would bolster this path, indicating a shift from downtrend to range breakout. Alternatively, invalidation could occur through a breakdown below $4.10, invalidating the oversold bounce as a fakeout; this might manifest as a liquidity sweep lower to test $3.80 or the next support cluster, triggered by failure to hold the local swing low and EMA confluence. Such a move would reinforce the bearish structure, potentially accelerating the downtrend toward the 99 EMA projection, especially if volume spikes on the downside, turning the fragile recovery into a full capitulation phase. In a mixed fakeout scenario, price could briefly spike to $5.50 on low-volume news-driven hype before fading, trapping early bulls and confirming distribution if it rejects the 7 EMA without follow-through.
What to Watch Next:
Monitor volume behavior closely, as a surge above recent $4 million averages on any upside move from $4.10 could validate liquidity inflow and support a range breakout, while sustained low volume might signal ongoing distribution. Track price reaction at the $5–$6 liquidity pocket, where a clean break above with closing prices above the middle Bollinger Band would hint at momentum building toward higher targets. Finally, observe RSI and MACD for divergence resolution: a sustained RSI rise above 40 without new lows, coupled with MACD zero-line approach, could indicate fading bearish pressure, but persistent oversold readings below 30 warrant caution for further tests lower.
Risk Note:
COAI's setup carries elevated risks due to its extreme volatility, with the 84% crash illustrating how quickly sentiment can shift; external factors like broader market selloffs or project-specific developments could amplify drawdowns beyond the stop loss level, emphasizing the probabilistic nature of these observations.
In summary, COAI stands at a pivotal juncture where technical oversold signals clash with bearish news undertones, demanding vigilant monitoring for directional clarity.
(Word count: 1723)
#COAI #CryptoAnalysis #AltcoinVolatility $COAI