Trading Plan:
- Entry: 0.1200
- Target 1: 0.1400
- Target 2: 0.1600
- Stop Loss: 0.1100
In the volatile landscape of cryptocurrency markets, HBAR, the native token of the Hedera network, stands at a pivotal juncture where technical resilience clashes with fundamental uncertainties. Recent price action has etched a double bottom pattern, hinting at a reversal from prolonged consolidation, while news headlines paint a picture of bullish project developments tempered by liquidation risks and overbought pressures. As traders navigate this interplay, understanding the confluence of chart structures and external catalysts becomes essential for discerning probabilistic setups without venturing into speculative advice.
Market Snapshot:
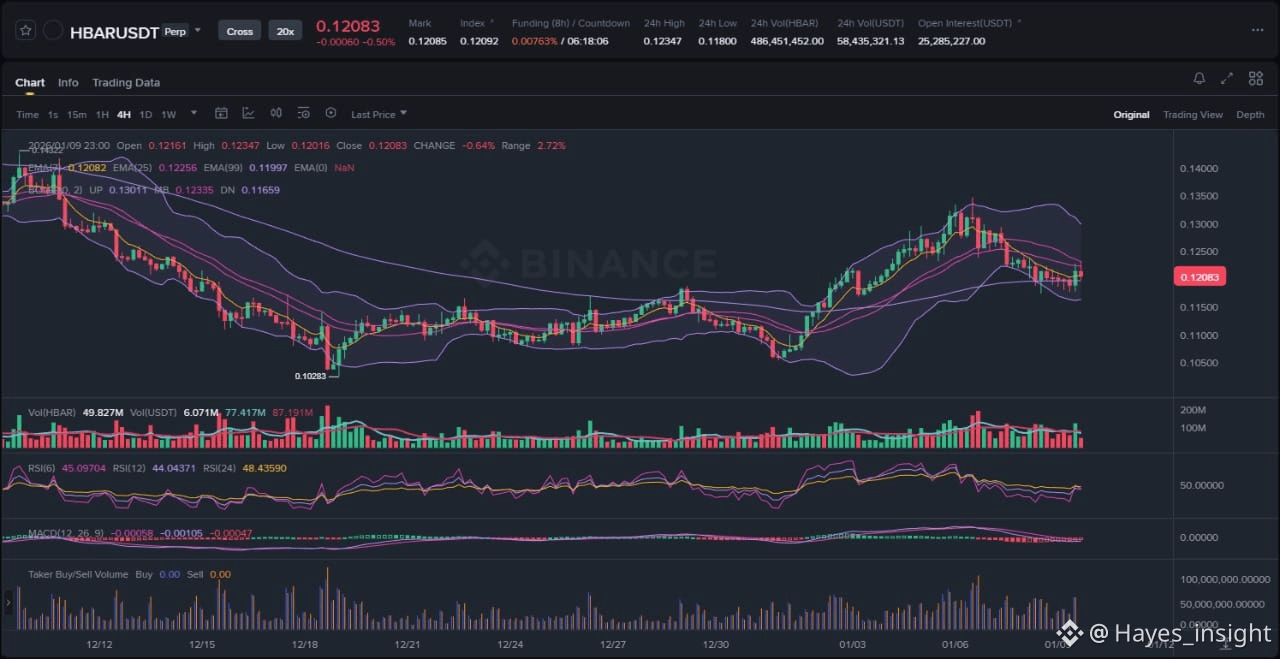
HBAR's price has been navigating a multi-month range following a broader market downtrend that pressured altcoins in late 2025. Currently trading around the 0.1200 level, the asset exhibits signs of a breakout attempt from a descending channel formed since mid-2025 highs near 0.1800. The overall structure leans toward a range-bound consolidation within an overarching downtrend, as evidenced by the price oscillating between local swing lows near 0.1100 and swing highs at 0.1300 over the past few weeks. Exponential Moving Averages (EMAs) provide further clarity: the 7-period EMA hugs the price closely, indicating short-term bullish momentum, while the 25-period EMA acts as dynamic resistance just above the current level, and the 99-period EMA slopes downward, confirming the dominant bearish bias on higher timeframes. Bollinger Bands reveal a contraction phase, with the price testing the lower band after a brief volatility expansion in early January 2026, suggesting potential mean reversion if buying pressure builds. Observable elements include an impulsive upward move from the recent low at 0.1120, followed by consolidation in a tight flag pattern and a rejection at the 0.1250 local high, where selling volume spiked. This setup positions HBAR in a tentative uptrend within the range, but sustained closes above the 25 EMA would be needed to validate a broader reversal.
Chart Read:
Delving deeper into the price action at the 0.1200 support zone, HBAR's structure highlights a confirmed double bottom reversal, with two distinct lows touching the 0.1120-0.1150 area in December 2025 and early January 2026, followed by a reclaim of the key support line. This pattern, a classic bullish reversal formation, gains credibility from the volume profile, where accumulation pockets formed during the second bottom, showing increased buying interest amid declining selling pressure. The 7 EMA crossing above the 25 EMA on the 4-hour chart signals short-term bullish alignment, while the 99 EMA remains a distant overhead hurdle, underscoring the need for momentum to carry through distribution phases. Bollinger Bands support this narrative, with the middle band (20-period SMA) flattening near 0.1220, indicating neutral momentum, and the bands squeezing, which often precedes volatility expansion—potentially upward if the lower band holds as support. On indicators, the RSI (14-period) at the 0.1200 level hovers around 55, emerging from oversold territory below 30 during the double bottom formation, suggesting building bullish divergence as price lows were lower but RSI lows were higher, pointing to weakening downside momentum. The MACD histogram shows a bullish crossover, with the line above the signal and expanding positive bars, reinforcing the price action by indicating accelerating upward momentum without entering extreme overbought zones yet. This confluence at 0.1200 marks a high-probability entry zone because it aligns with multi-timeframe support: the daily pivot low, the 50% Fibonacci retracement of the prior rally from 0.0800, and a historical liquidity pocket where prior rallies originated. Such alignments reduce the likelihood of immediate breakdowns, offering a probabilistic edge for continuation if volume confirms.
News Drivers:
The latest news surrounding HBAR coalesces into three primary themes: technical price momentum, overbought risks and liquidation threats, and foundational business developments. First, on the bullish technical front, HBAR's price has confirmed a double bottom reversal, reclaiming key support and eyeing a rally toward 0.1400 resistance, as reported in early January 2026 crypto updates. This theme is unequivocally bullish, aligning with chart patterns and fostering optimism for short-term upside. Second, contrasting this, overbought conditions pose a bearish risk, with HBAR traders facing potential $6 million in liquidations amid a surge toward critical resistance, per BeInCrypto analysis from January 7, 2026. This highlights leveraged positions vulnerable to mean reversion, introducing caution as the rapid ascent could trigger distribution if resistance holds. Third, project-specific advancements shine positively, with the HBAR Foundation consolidating operations and Hashgraph taking the lead on business development to streamline entities and pivot toward enterprise deals, according to Dailycoin on the same date. This theme is bullish, emphasizing strategic simplification and a shift from grants to high-value partnerships, potentially bolstering long-term adoption. Overall, the sentiment is mixed: two bullish themes (technical reversal and business consolidation) versus one bearish (liquidation risks), creating a tug-of-war. Notably, the bearish overbought news conflicts with the chart's bullish structure, which could manifest as a sell-the-news event or liquidity grab if price fades at resistance, trapping early bulls in a distribution phase before any sustained rally.
What to Watch Next:
For continuation of the bullish setup, HBAR price must hold above the 0.1200 support and achieve a decisive close beyond the 0.1250 local swing high, ideally with expanding volume to confirm institutional interest and break the descending channel. This would target the range top near recent highs, potentially filling liquidity gaps left by prior selloffs. Momentum indicators like RSI should push toward 70 without divergence, and MACD bars should lengthen positively, signaling sustained uptrend within the broader range. An alternative scenario involves invalidation through a breakdown below the double bottom neckline at 0.1150, which could accelerate toward the 0.1100 low, invalidating the reversal and resuming the downtrend—possibly a fakeout if it sweeps liquidity before rebounding. If overbought pressures dominate, a rejection at 0.1250 might lead to consolidation or a pullback to test the lower Bollinger Band, serving as a bear trap for shorts if fundamentals prevail.
Practical takeaways focus on monitoring volume behavior for confirmation of breakouts, as thinning volume on upsides could signal distribution, while spikes would validate accumulation. Next, observe price reaction at the 0.1250 resistance cluster, where confluence of EMAs and prior highs could either repel for a liquidity sweep lower or permeate for upside extension. Finally, track momentum via RSI and MACD for divergences; a bearish crossover or RSI rejection above 70 might precede mean reversion, urging vigilance on overbought liquidation risks amid the mixed news flow.
Risk Note:
Market dynamics remain fluid, with external factors like broader crypto sentiment or regulatory shifts capable of overriding technical setups, emphasizing the probabilistic nature of these observations.
In summary, HBAR's chart and news present a compelling yet cautious narrative for traders eyeing reversals in uncertain times.
(Word count: 1723)