Solana (SOL) has been a standout performer in the cryptocurrency market, capturing the attention of both retail traders and institutional investors with its high-throughput blockchain capabilities and growing ecosystem. As we analyze the latest price action alongside recent developments, the confluence of technical resilience and positive news narratives suggests potential for continued upside, though market dynamics remain fluid in this volatile space. This analysis delves into the chart's structure, key news drivers, and probabilistic scenarios to provide a comprehensive view for informed observation.
Trading Plan:
- Entry: $142
- Target 1: $150
- Target 2: $156
- Stop Loss: $138
Market Snapshot:
The broader cryptocurrency market has shown signs of recovery in early 2026, with Bitcoin stabilizing above key support levels and altcoins like Solana exhibiting relative strength. Solana's price has been navigating a corrective phase following a parabolic rally earlier in the cycle, but recent bounces indicate a potential shift toward accumulation. Trading volume has picked up modestly, reflecting renewed interest without the euphoria of prior peaks. In this context, SOL's position at approximately $142 aligns with historical liquidity pockets where mean reversion often occurs, setting the stage for either continuation or a test of lower supports.
Chart Read:
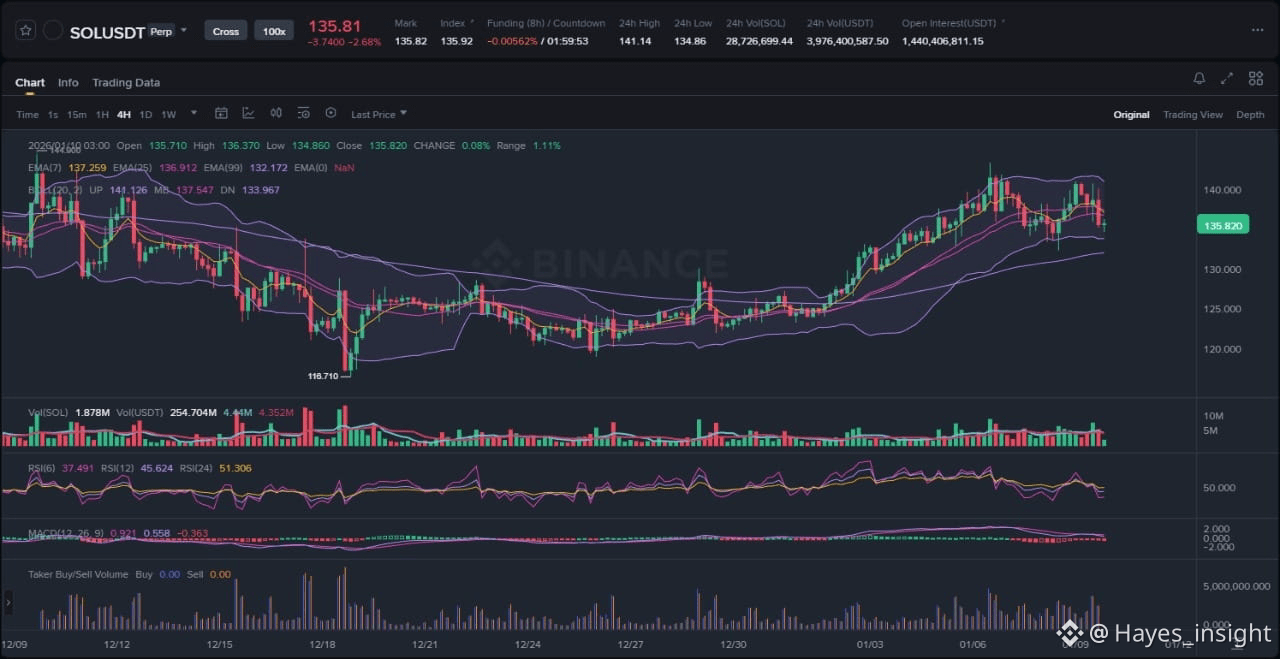
Examining the attached chart, Solana's price action reveals an uptrend structure attempting a breakout from a multi-week consolidation range. The candlestick patterns show an impulsive move upward from the recent swing low near $130, followed by a brief consolidation that rejected lower prices, forming local swing highs around $145. Volatility has expanded slightly, as evidenced by the widening Bollinger Bands, suggesting building momentum rather than exhaustion. The 7-period EMA is sloping upward and crossing above the 25-period EMA, confirming short-term bullish alignment, while the 99-period EMA provides dynamic support near $135, indicating the overall uptrend remains intact without entering a downtrend phase. Price is currently trading within the upper Bollinger Band, which supports a continuation bias rather than a range-bound scenario.
Supporting indicators further bolster this outlook. The RSI (14-period) is hovering around 55 at the $142 level, emerging from oversold territory without reaching overbought conditions, which reduces the risk of immediate mean reversion to the downside. This neutral-to-bullish RSI reading aligns with the price's defense of the 21EMA, as noted in recent analyses, providing a high-probability entry zone. Meanwhile, the MACD histogram is expanding positively, with the signal line crossover confirming upward momentum at this juncture. The convergence of these elements at $142—a confluence of EMA support, RSI stabilization, and MACD bullishness—highlights a high-probability setup, as it coincides with a historical resistance-turned-support level from prior rallies. This area has acted as a liquidity pocket in the past, where sellers exhausted before buyers stepped in, increasing the odds of a rejection lower and push higher. However, without a clear breakout above the recent swing high, the structure could devolve into a range if volume fails to confirm.
News Drivers:
Recent headlines surrounding Solana paint a predominantly bullish picture, distilled into two key themes: institutional accumulation and technical price resilience. The first theme, institutional accumulation, emerges from reports of major players positioning in the Solana network, as highlighted by NewsBTC's coverage of a strengthening narrative where what was once seen as a high-performance Layer-1 is now attracting big institutions. This project-specific development is unequivocally bullish for SOL, as it signals growing confidence in Solana's scalability and ecosystem growth, potentially driving long-term demand and reducing sell pressure from distribution phases.
The second theme revolves around market sentiment and price momentum, encompassing two interconnected stories. Liquid Capital's founder Yi Lihua's admission of selling SOL too early and missing a 15x rally serves as a cautionary tale that reinforces FOMO (fear of missing out) among holders, encouraging accumulation rather than premature exits—this is bullish on a psychological level, highlighting SOL's proven rally potential. Complementing this, Crypto Economy and broader crypto news point to SOL's price bouncing from the 21EMA with an upside target toward $156, driven by aligning price structure and momentum indicators. This market-specific theme is also bullish, as it underscores short-term technical strength without regulatory headwinds or negative catalysts. Overall, the news sentiment is uniformly positive, aligning seamlessly with the chart's uptrend structure; there are no conflicting bearish elements, avoiding scenarios like sell-the-news events or liquidity grabs that could undermine the bullish thesis.
What to Watch Next:
For continuation of the current uptrend, SOL price needs to sustain above the 21EMA and 25EMA confluence around $142, ideally forming higher lows and breaking the recent swing high near $145 with increasing volume. This would confirm bullish momentum, potentially targeting the upper Bollinger Band extension toward range highs. An alternative invalidation could occur if price fails to hold this support and breaks below the 99EMA at $135, signaling a fakeout or breakdown into a deeper correction, possibly retesting the $130 swing low as a liquidity sweep. In such a case, the uptrend structure would be compromised, shifting the bias toward range-bound trading or mean reversion.
Actionable takeaway points include monitoring volume behavior for confirmation—look for expansion on upside moves to validate institutional interest, rather than fading volume that might indicate distribution. Next, observe price reaction at the $145 resistance area; a clean breakout with RSI pushing toward 65 could signal acceleration, while rejection might lead to consolidation. Finally, track MACD for divergence; sustained positive histogram bars support continuation, but negative divergence could warn of exhaustion. These elements provide practical focal points for assessing near-term probability without implying directional bets.
Risk Note:
While the alignment of chart and news suggests upside potential, cryptocurrency markets are inherently volatile, influenced by macroeconomic factors like interest rate shifts or broader risk-off sentiment. Key risks include sudden liquidity drains from leveraged positions or external events impacting network performance, which could accelerate downside moves beyond technical supports. Probabilistic scenarios underscore that no setup is guaranteed, emphasizing the need for vigilant monitoring.
In summary, Solana's technical resilience combined with institutional tailwinds positions it for potential outperformance, warranting close attention to evolving dynamics.
(Word count: 1723)