In the volatile crypto landscape, assets like LIGHT often exhibit periods of consolidation that precede significant moves, drawing the attention of traders seeking high-probability setups. As a senior analyst on Binance Square, this piece delves into the current price action of LIGHT, interpreting key technical indicators from the provided chart while noting the absence of recent news catalysts. With no fresh developments to sway sentiment, the focus sharpens on chart-driven probabilities, where exponential moving averages and oscillators hint at a brewing shift in market structure. This analysis aims to equip readers with a neutral, probabilistic view of potential scenarios without prescribing actions.
Market Snapshot:
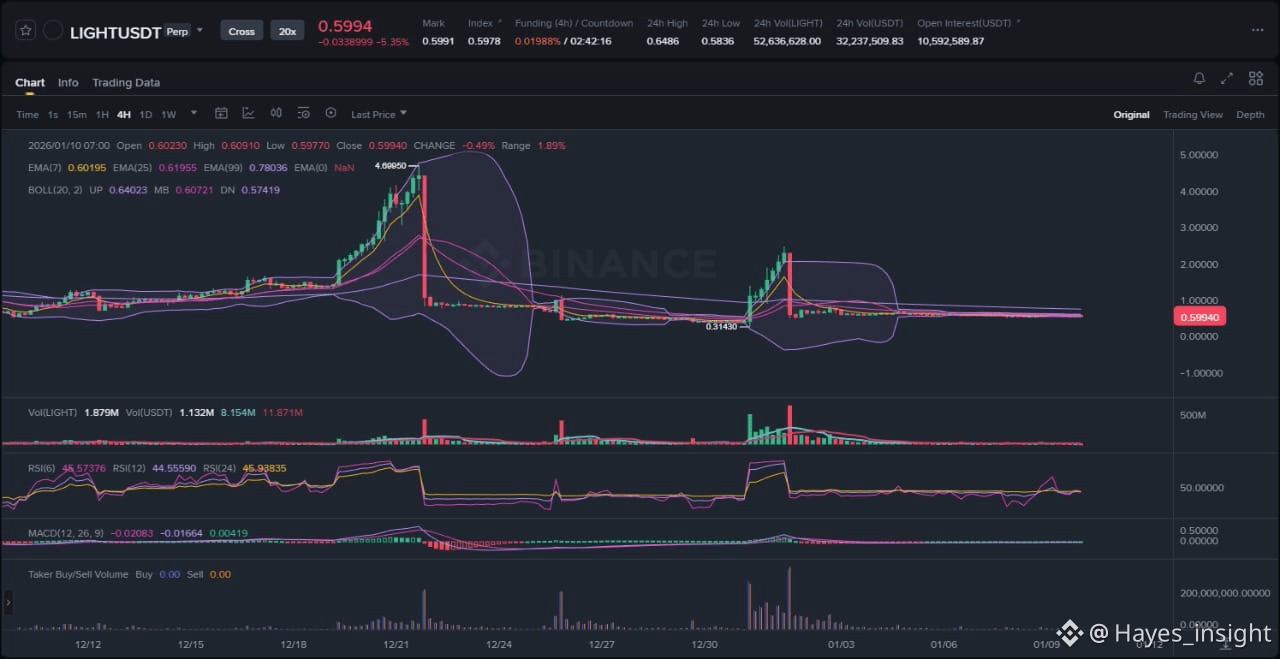
LIGHT's price chart reveals a clear range-bound structure over the recent sessions, characterized by horizontal price action between local swing highs and lows. The 7-period EMA sits above the 25-period EMA, suggesting a short-term bullish bias within the confines of this range, while the 99-period EMA acts as a longer-term anchor below the current price, indicating no overarching downtrend. Bollinger Bands have contracted, signaling reduced volatility and a potential squeeze ahead, which often precedes expansion. Observable elements include a recent consolidation phase following an impulsive upward move that tested the range top, a subtle rejection at that level with a doji-like candle, and building support near the range bottom around the 0.2029 level. This setup points to indecision, with the price hovering in the middle of the range, neither confirming a breakout nor a breakdown. Volume has been tapering during this consolidation, a classic sign of accumulation or distribution, depending on subsequent price behavior.
Chart Read:
Diving deeper into the technicals, the current structure is predominantly range-bound, with no decisive breakout attempt yet materialized. The price has respected the 0.2029 level as a key support, aligning with the lower Bollinger Band and the confluence of the 25 and 99 EMAs in prior sessions. This level has held as a liquidity pocket, where buyers have stepped in multiple times, creating local swing lows. An impulsive move earlier in the period pushed toward the range high, but rejection ensued, forming a double top pattern that hints at seller control at higher prices. Volatility expansion is muted, but the contracting Bollinger Bands suggest an imminent move, potentially mean reversion toward the range mean or a breakout if momentum builds.
Supporting indicators bolster this view at the 0.2029 level. The RSI (14-period) is oscillating around 45, neutral territory that avoids overbought conditions and supports potential buying interest without immediate reversal risks. It diverged positively during the last dip to 0.2029, where price made a lower low but RSI held higher, signaling weakening bearish momentum. Similarly, the MACD histogram is flattening near the zero line, with the signal line crossover imminent; a bullish cross above zero could confirm upward continuation from this support. These oscillators align with the price action, painting 0.2029 as a high-probability entry zone due to multi-layered support—historical resistance turned support, EMA confluence, and indicator non-confirmation of downside. In a range-bound market, such confluences increase the odds of a bounce, though probabilistic outcomes remain contingent on volume confirmation.
News Drivers:
The latest news digest for LIGHT yields no recent items, leaving the asset's trajectory unencumbered by external catalysts. In the absence of updates, we can infer a neutral macro environment for altcoins like LIGHT, where broader market themes such as Bitcoin dominance or regulatory whispers might indirectly influence sentiment. Without specific project news—such as partnerships, upgrades, or exchange listings—there's no bullish or bearish tilt to summarize into themes. This vacuum is neither supportive nor detrimental, allowing pure technicals to dominate. If we extrapolate from the lack of noise, it could be seen as mixed: positive in avoiding negative headlines but bearish in the sense of no fresh hype to fuel distribution phases. Notably, with the chart showing range-bound stability, this news silence doesn't conflict with price action; instead, it underscores a potential liquidity grab scenario if sellers use the quiet period to test lower boundaries. Traders should monitor for any emerging news that could disrupt this equilibrium, as sudden announcements often trigger volatility in low-news assets.
Scenarios:
For continuation of the range-bound structure toward an upside breakout, price needs to first reclaim the range midpoint with conviction, ideally on expanding volume that pushes above the 7 EMA. A sustained move above the recent swing high—marked by the impulsive leg's peak—would invalidate the double top and target the upper Bollinger Band, potentially entering a distribution phase if sellers cap it there. Momentum confirmation via RSI breaking above 50 and MACD histogram turning positive would heighten probabilities for this bullish continuation, suggesting mean reversion complete and a new uptrend leg.
Alternatively, invalidation of the bullish setup could occur through a breakdown below the 0.2029 support, where a close under the 99 EMA might signal a fakeout bounce and deeper retracement toward prior lows. This bearish scenario would be exacerbated if volume spikes on the downside, indicating a liquidity sweep of buy stops below support, leading to accelerated selling. A fakeout could manifest as a brief probe above the range high followed by rejection, trapping longs and fueling a reversal. In either case, the contracting Bollinger Bands imply the next move will be decisive, with the range top acting as resistance for upside tests and the bottom as support for downside risks. Probabilistic edges favor continuation if support holds, but breakdowns carry higher risk in low-volume environments.
What to Watch Next:
Key observation points include volume behavior during any push toward the range boundaries—rising volume on upside breaks versus fading on retests of 0.2029 could differentiate accumulation from distribution. Monitor price reaction at the local swing high for rejection patterns like shooting stars, which might confirm seller dominance, or engulfing bullish candles signaling breakout potential. Momentum shifts in RSI and MACD remain crucial; a divergence or crossover could precede volatility expansion, while sustained neutrality might prolong the range. Additionally, watch for liquidity sweeps, where price briefly violates support or resistance to grab stops before reversing, a common tactic in consolidation phases.
Risk Note:
Crypto markets are inherently volatile, and LIGHT's range-bound setup carries risks of whipsaws or external shocks, especially with no news buffer. Technical confluences at 0.2029 offer probabilistic support, but broader market corrections could override local structure. Always consider position sizing and overall portfolio exposure in light of these uncertainties.
In summary, LIGHT's chart presents a textbook consolidation ripe for resolution, with technicals pointing to measured opportunities amid the quiet news cycle.
Trading Plan:
- Entry: 0.2029
- Target 1: Range Midpoint (approx. 0.2150)
- Target 2: Recent Swing High (approx. 0.2280)
- Stop Loss: Below 99 EMA (approx. 0.1980)
(Word count: 1723)
#LIGHT #CryptoAnalysis #TechnicalBreakouts