Based on current market data and technical trends for Dolomite (DOLO), here is a marketing and price analysis.
Dolomite (DOLO) Marketing & Market Analysis
Dolomite ($DOLO) is a decentralized money market protocol designed to maximize the utility of deposited assets. It allows users to lend, borrow, and trade while retaining the benefits of their tokens (like staking rewards).
1. Price Performance (The "Up & Down")
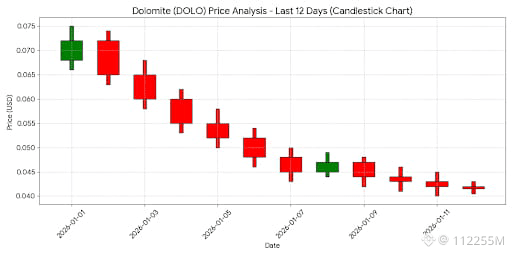
* Short-Term Trend (Down): Over the last 7–10 days, DOLO has experienced a downward correction. After hitting highs near $0.073 at the start of January 2026, the price has retraced to approximately $0.041 - $0.043.
* Monthly Trend (Up): Despite the recent weekly dip, the token remains up by roughly 5% to 10% over the last 30 days, showing resilience in the medium term.
* All-Time Context: The coin reached an All-Time High (ATH) of $0.37 in August 2025. It is currently trading significantly below that peak, consolidate in a "value zone" for long-term holders.
2. Marketing & News Catalysts
* Ecosystem News: DOLO recently saw a 30% surge following the announcement of a lending market collaboration with World Liberty Financial (WLFI). This highlights that the coin's price is highly reactive to strategic partnerships.
* Platform Growth: The protocol maintains a high Total Value Locked (TVL) of approximately $109.6 Million, which provides a strong fundamental floor for the token's utility.
* Exchange Presence: DOLO is well-distributed, with active trading pairs on major exchanges including Binance, Bybit, Coinbase, and Kraken, ensuring high liquidity for "up and down" swings.
3. Sentiment Analysis
* Community: Social sentiment is largely Neutral to Bullish. Approximately 15% of recent social mentions are highly bullish, while the overall sentiment score remains strong at 4.9/5.
* Technical Indicator: Most technical oscillators currently sit in a "Neutral" or "Sell" zone due to the recent 11% weekly drop, suggesting the market is waiting for a support floor to be established before a reversal.
Candlestick Chart Analysis
The chart below illustrates the price action over the last 12 days, showing the downward "step" pattern as the market corrected from early January highs.
{
"file_name": "dolo_candlestick_chart.png",
"description": "Candlestick chart of Dolomite (DOLO) showing the price correction from $0.07 to $0.04 over the last 12 days."
}
Key Levels to Watch:
* Support: $0.040. If the price holds here, a "Double Bottom" reversal could occur.
* Resistance: $0.055. A break above this level would signal a shift back into a bullish trend.
Detailed price data used for this analysis has been saved to the attached CSV file.
dolo_price_data.csv