Date: January 13, 2026
Market Status: Fearful (Fear & Greed: 27) | $XRP Price: ~$2.05
While the broader cryptocurrency market is currently gripped by fear, leading to choppy price action and visible red candles across many assets, XRP is quietly forming one of the most reliable bullish reversal patterns in technical analysis.
On the surface, XRP appears to be struggling, consolidating around $2.05 with a slight 24-hour decline. However, looking beneath the immediate price action reveals a different story—one where "smart money" whales are heavily positioned long, waiting for a specific technical trigger to ignite the next rally.
Here is a breakdown of why the current red candles may be a bear trap before a significant move upward.
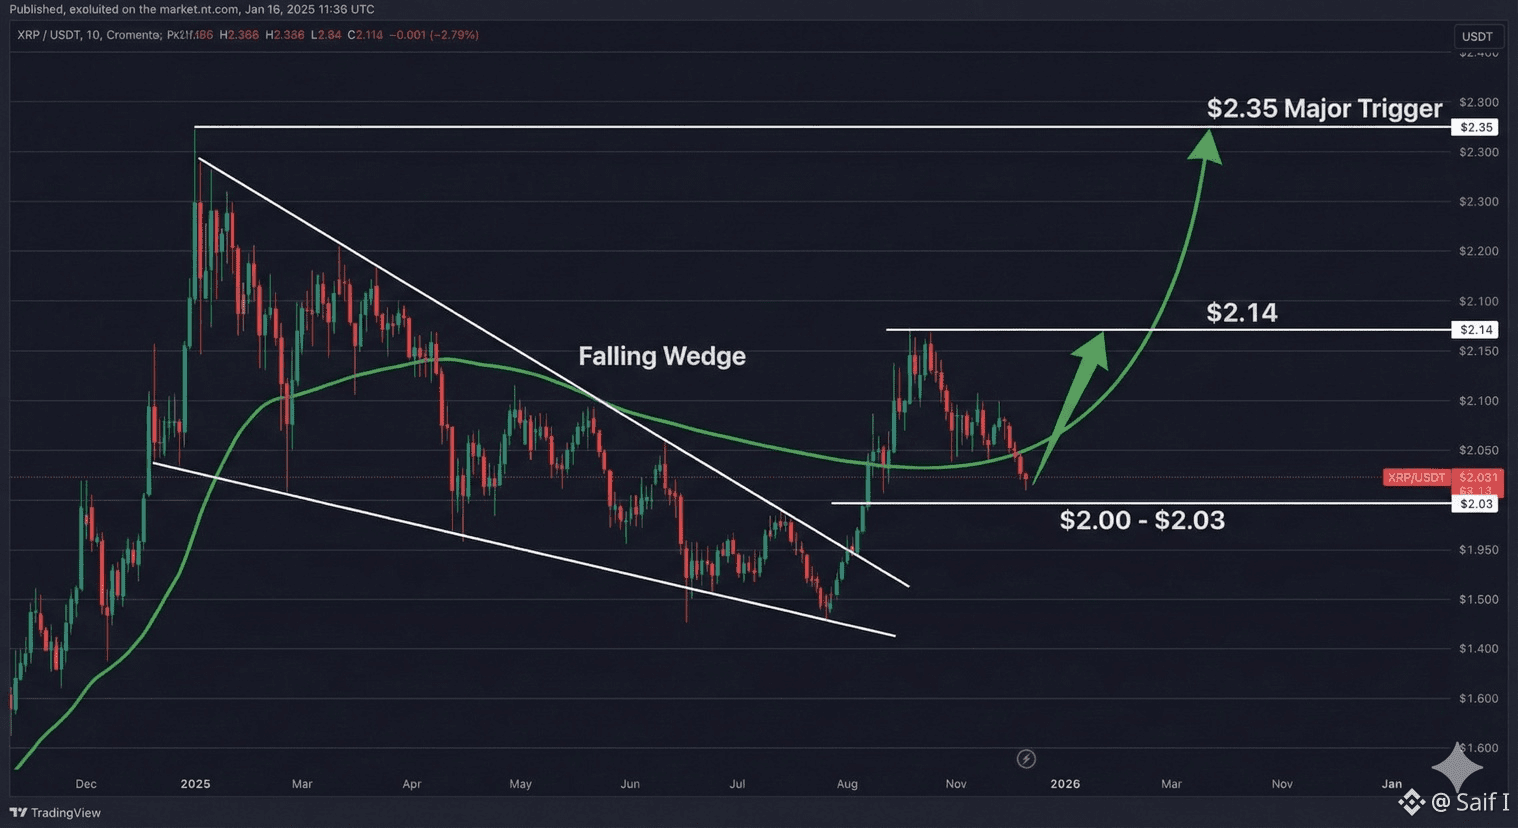
The Primary Pattern: The Bullish Falling Wedge
Over the past several weeks, XRP has been trading within a Falling Wedge on the daily chart.
A falling wedge is characterized by lower highs and lower lows, where the trading range tightens over time like a coiling spring. Traditionally, this is a bullish reversal pattern that resolves when price breaks violently to the upside.
The "Retest": Why We Are Seeing Red Today
Crucially, XRP already initiated an initial breakout from this wedge, surging briefly to roughly $2.14. What we are witnessing right now is a classic technical phenomenon known as a "Retest."
After breaking through a resistance ceiling, price often drops back down to touch that former ceiling to confirm it has flip-flopped into a support floor. The current red candles are simply price testing the $2.00 - $2.03 zone. If this level holds, it confirms the breakout is valid, and the real upward momentum usually begins shortly after.
The Roadmap: Key Levels to Watch
For the narrative to shift from slow red candles to explosive green ones, XRP needs to navigate three critical price zones.
• The Floor (Support): $2.00 - $2.03
This is the line in the sand. As long as XRP closes daily candles above this psychological level (which aligns with the top of the fallen wedge), the bullish structure remains intact.
• The Confirmation (Resistance): $2.14
This is the recent local high. Breaking back above this level confirms that the current "retest" phase is finished and buyers have regained control.
• The Major Trigger (Breakout): $2.35
This is the most critical level on the chart. The 200-day Exponential Moving Average (EMA) sits here. A decisive cross above $2.35 is often the signal that brings retail FOMO (fear of missing out) back into the market, leading to the type of large, fast green candles that traders are looking for.
Conclusion
While the current market sentiment is fearful, the technicals for XRP suggest the current downward drift is a healthy consolidation rather than the start of a crash.
Data indicates that top traders on major exchanges are betting heavily on a bounce (with an unusually high Long/Short ratio of over 3:1). They are betting that the $2.00 floor will hold, setting the stage for a run toward the $2.35 trigger level. The current red candles may be the final opportunity for accumulation before the wedge pattern completes its cycle.
#StrategyBTCPurchase #CPIWatch #USNonFarmPayrollReport #USJobsData #WriteToEarnUpgrade
