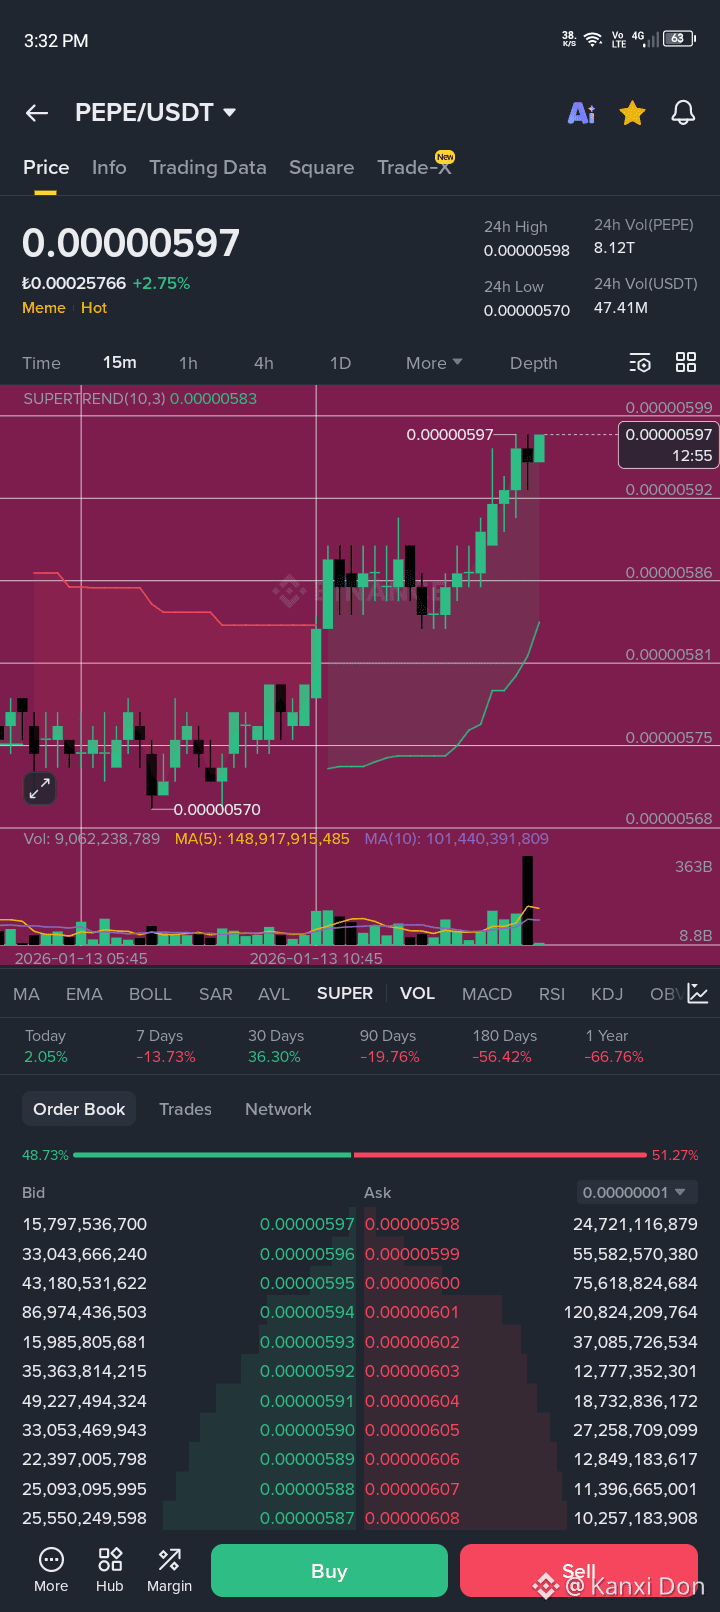
#pepe $PEPE This is a 15-minute PEPE/USDT trading chart from a crypto exchange. Here’s a clear breakdown of what you’re seeing and what it means:
.
.
1. Price & Market Snapshot
Current price: 0.00000597 USDT
24h change: +2.75% → short-term bullish
24h High / Low: 0.00000598 / 0.00000570
Volume: High activity (PEPE trades heavily, meme coin behavior)
2. Timeframe
15m candles → short-term / intraday trading
Each candle = 15 minutes of price action
3. Trend (Very Important)
SuperTrend Indicator (10,3)
SuperTrend value: ~0.00000583
Price is above SuperTrend
Background is bullish (purple/red zone)
👉 Meaning:
The trend has flipped bullish, and buyers are in control for now.
4. Price Action
Strong impulsive move up from ~0.00000570
Series of higher highs & higher lows → bullish structure
Small consolidation near the top → possible pause before next move
5. Key Levels
Resistance
Immediate resistance: 0.00000598 – 0.00000600
Big sell walls visible at 0.00000600+
Support
Near support: 0.00000592
Strong support: 0.00000583 (SuperTrend line)
Breakdown below 0.00000583 → trend may weaken
6. Volume Analysis
Volume spiked during the breakout
Confirms the upward move is not fake
Recent candles show slightly lower volume → consolidation phase
7. Moving Averages (Volume MA)
MA(5) > MA(10) → short-term momentum is bullish
Volume expansion earlier supports continuation potential
8. Order Book (Market Pressure)
Bids: 48.73%
Asks: 51.27%
👉 Slightly more sellers than buyers near resistance
→ Explains why price is struggling around 0.00000600
9. What This Means (Summary)
Bias: Short-term bullish
Condition: Near resistance
Expectations:
✅ Break & hold above 0.00000600 → continuation upward
❌ Rejection → pullback toward 0.00000583 – 0.00000590
10. Simple Trading Insight (Not Financial Advice)
Trend traders: Stay bullish while above SuperTrend
Scalpers: Watch rejection or breakout at 0.00000600
Risk signal: 15m close below 0.00000583
.
.