
The quiet accumulation is over—DASH just woke up with a massive vertical move! Analyzing the 4-Hour chart, we are witnessing a classic volatility breakout that has caught many traders by surprise.
Key Chart Observations:
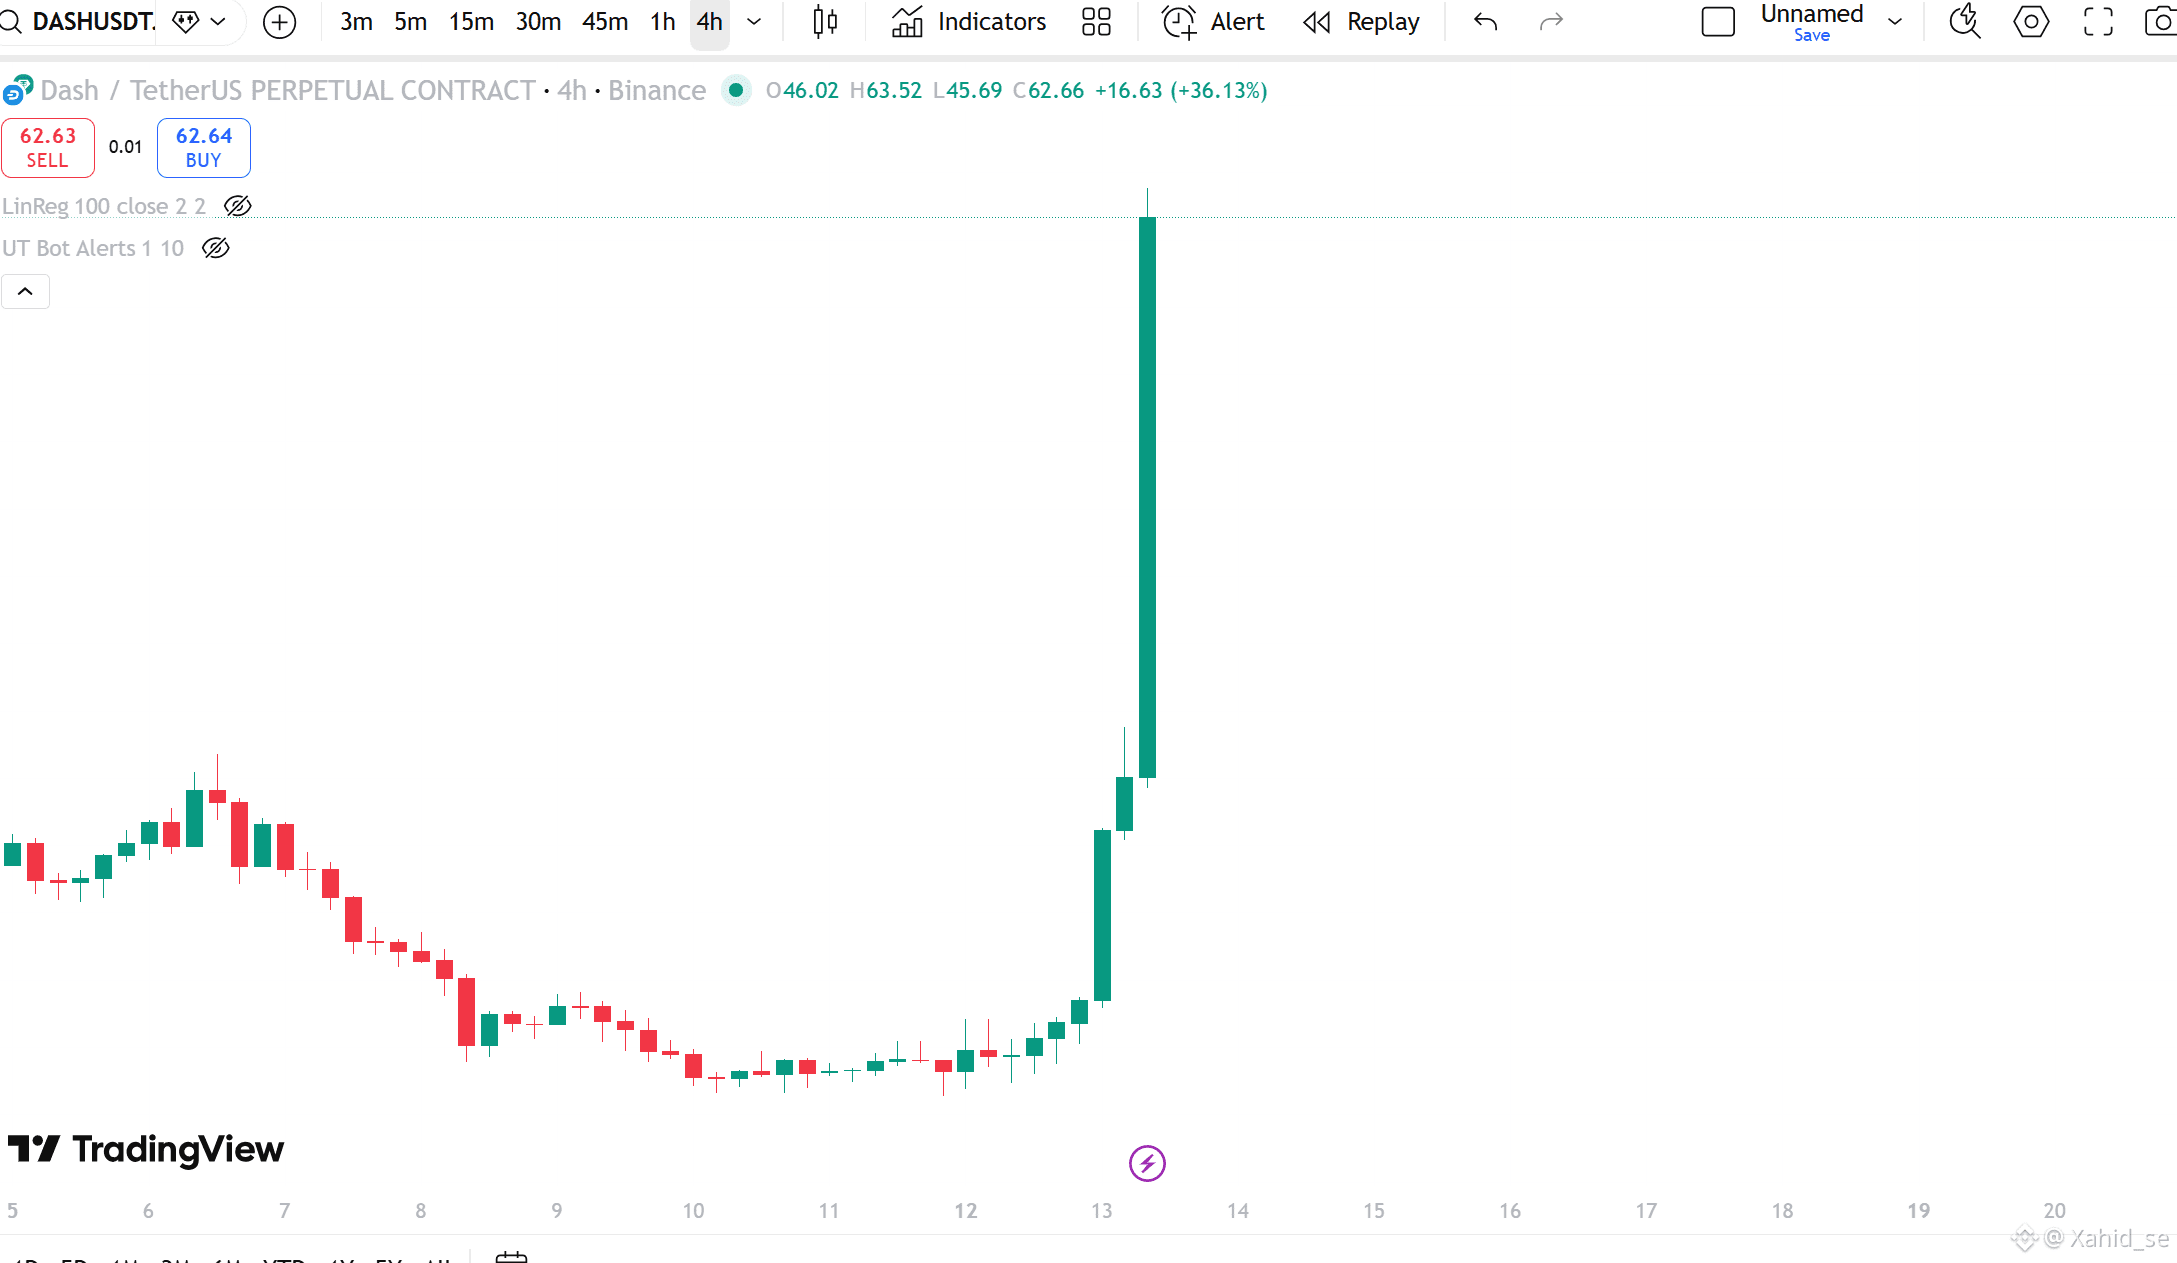
The "God Candle": After days of low volatility, DASH printed a massive bullish candle, surging from an open near $46.02 to a high of $63.52. That is a staggering +36.13% gain in a very short window.
Accumulation Breakout: Between Jan 9 and Jan 12, the price formed a "Rounded Bottom" (accumulation zone), trapping shorts and boring longs. This sudden expansion proves that buyers have aggressively stepped in.
Market Structure Shift: The price action has gone completely parabolic, shattering previous local resistance levels without pausing.
Trader's Outlook & Strategy:
⚠️ Caution for FOMO: While the momentum is incredibly strong, chasing a vertical green line is risky. On the 4H timeframe, indicators are likely screaming "Overbought."
Wait for the Retest: A healthy trend usually requires a pullback. Watch for the price to stabilize or form a "Bull Flag." Key support levels to watch on a retracement would likely be around the $55 - $58 range.
Next Targets: If the volume sustains, bulls will be looking to flip $63 into support for a push toward $70. If this is a "pump and dump," expect a rapid wick rejection back down.
What's your move?
Are you taking profits on this spike or holding for $70+? Let me know in the comments! 👇