
#Verge #XVG #XVGUSDT
One way to know when a chart is truly bullish, absolutely bullish, is when it trades above numerous moving averages. And this is exactly what is happening today with XVGUSDT (Verge).
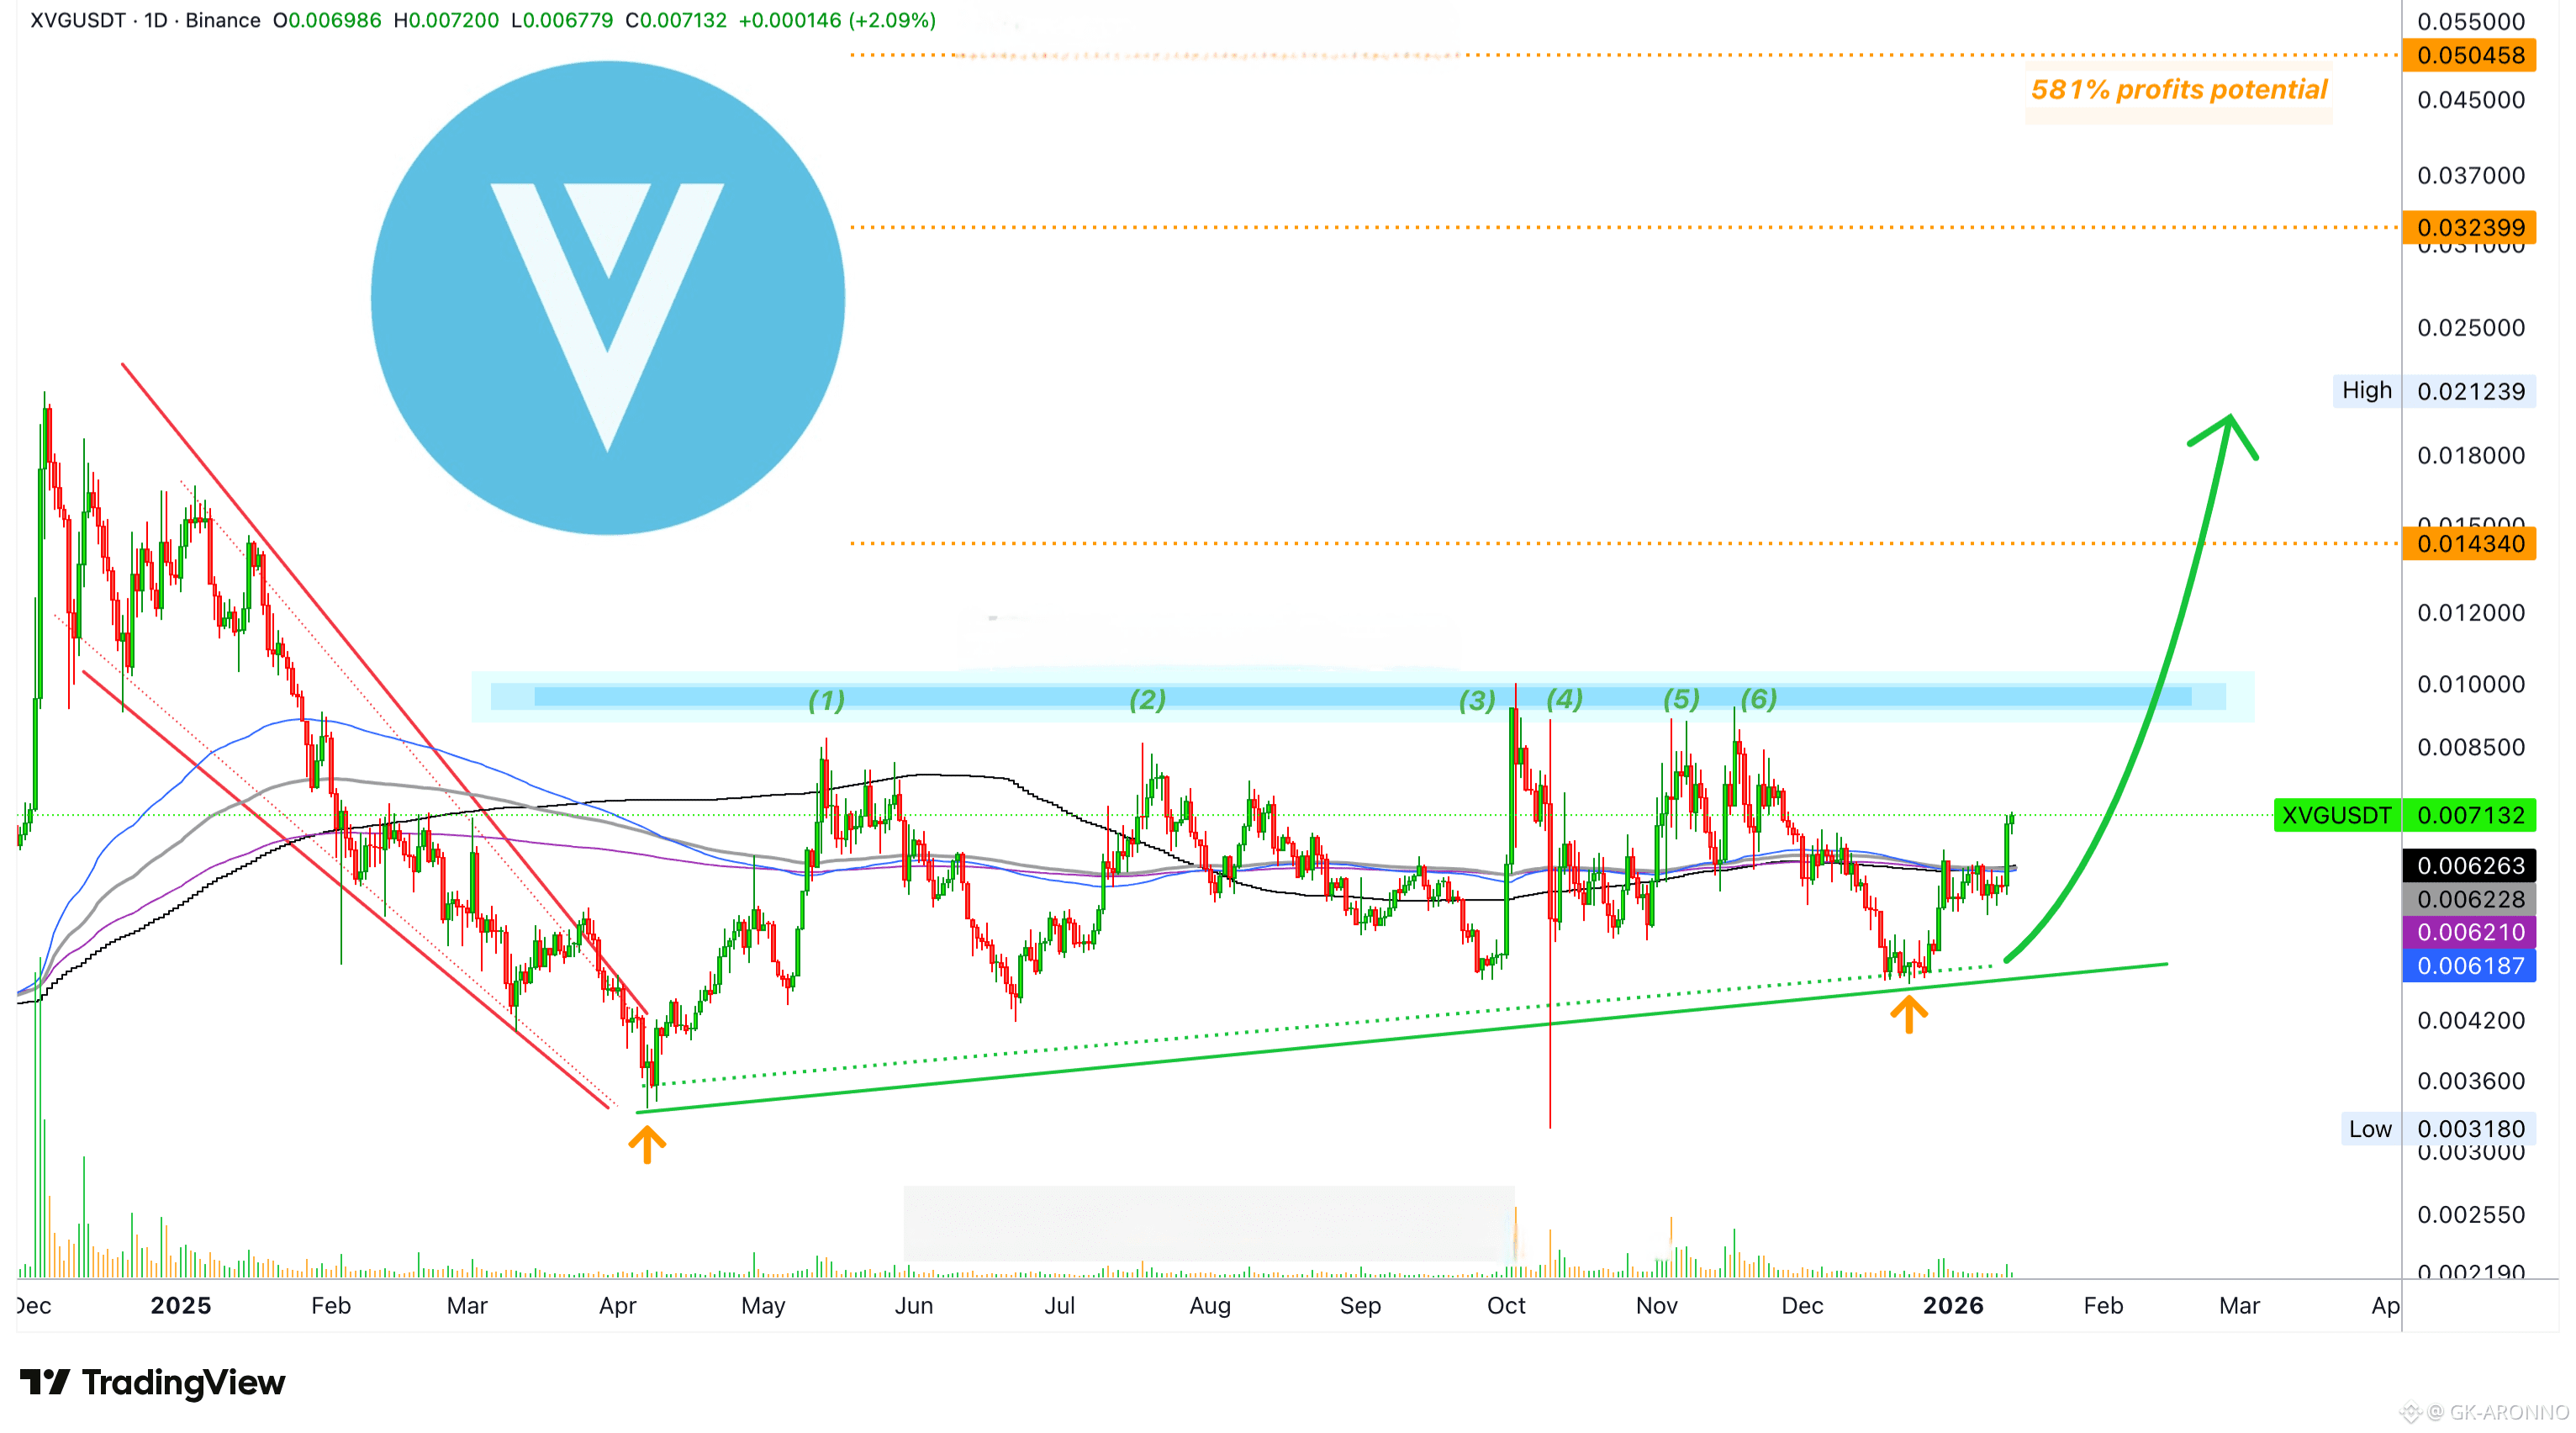
Just yesterday, Verge managed to break and close above all of the moving averages we track, including those long long-term ones such as MA200, EMA377, EMA233 and EMA144. You can see them plotted on the chart. This is the move and the signal.
Trading briefly moved below these levels but only to produce a long-term higher low. December vs April 2025. Since we have this higher low in place we can now expect a higher high compared to the last major peak which is early October last year.
This means that a price of $0.010 will break for sure, opening $0.021 as the next resistance zone. This is the high from December 2024. This is the level that will be challenged on the current move. Higher high first followed by a challenge of this target.
Thank you for reading. The altcoins market is about to heat up.
Namaste.
✅ Trade here on $XVG
