The crypto market is currently at a decisive juncture. After a period of consolidation and downward movement, the Total Market Cap ($) chart is showing signs of a potential trend reversal. Let’s dive into the technical details.
🔍 Technical Breakdown
Based on the current 15-minute chart using Smart Money Concepts (SMC), here is what we are observing:
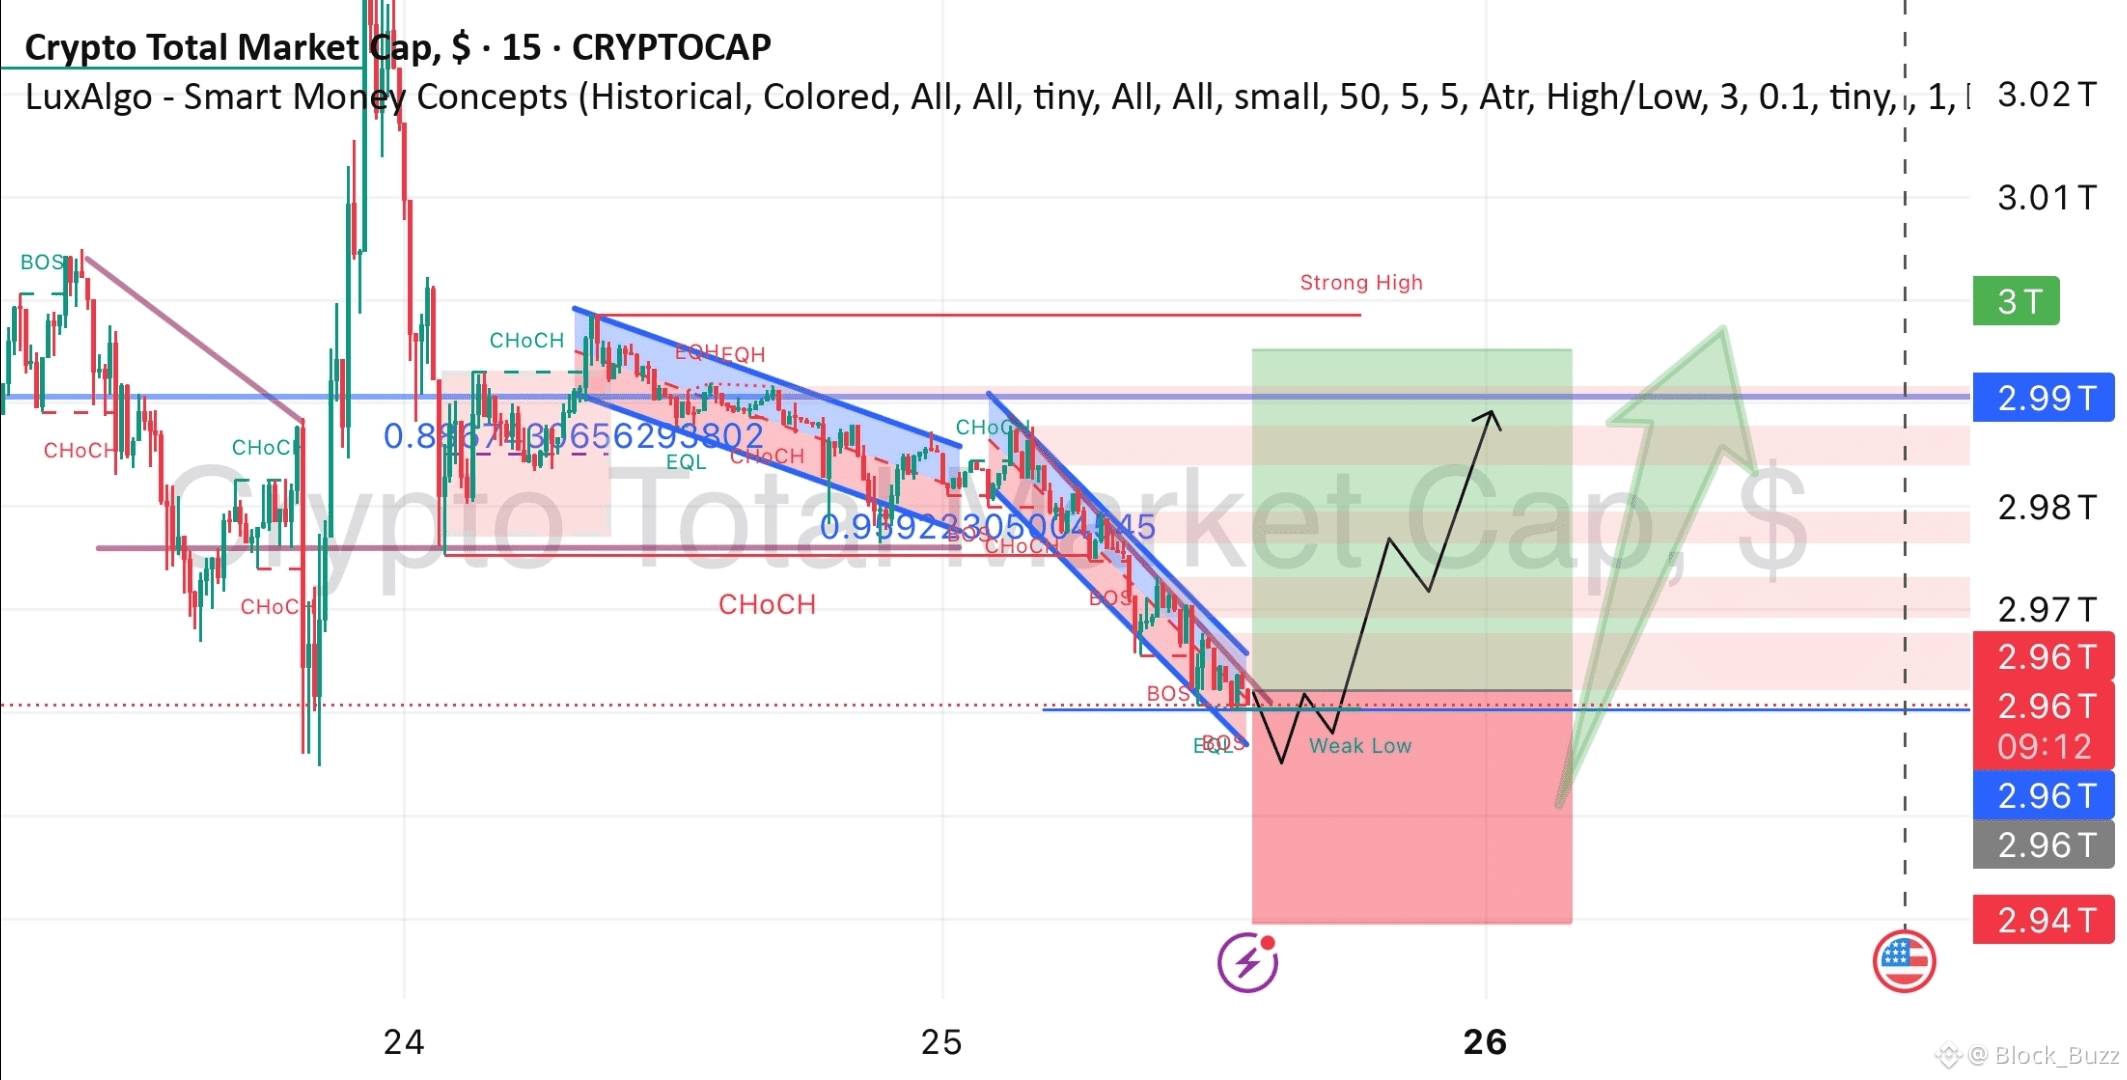
Market Structure: After a series of bearish BOS (Break of Structure), the price is now approaching a major historical support zone.
The Falling Channel: Price action has been trapped in a descending channel. It is currently testing the lower boundary, forming what we call a "Weak Low."
Liquidity Grab: There is significant liquidity sitting just above the $2.99T level, which often acts as a price magnet.
📈 Key Trading Levels to Watch:
Immediate Support: $2.96T (Must hold to maintain bullish reversal hope)
Critical Resistance: $2.99T (Breakout target; high volume expected here)
Major Target: $3.02T (The "Strong High" zone and psychological barrier)
Invalidation Point: $2.94T (Below this, the bearish trend continues)
💡 Market Sentiment & Conclusion:
The current setup suggests a potential Long Opportunity if the price successfully breaks out of the descending resistance line. A bounce from the $2.96T area could lead to a relief rally in Altcoins as capital flows back into the market.
⚠️ Disclaimer: This analysis is for educational purposes only and does not constitute financial advice. Crypto trading involves high risk. Always perform your own research (DYOR) and manage your risk before entering any trade.
#bitcoin #TradingSignal #SmartMoneyConcepts #TotalMarket #Write2Earn