Why $BTC Price Is Dumping / Under Pressure (4H Chart Analysis)
1️⃣ (Strong Bearish Trend Structure)
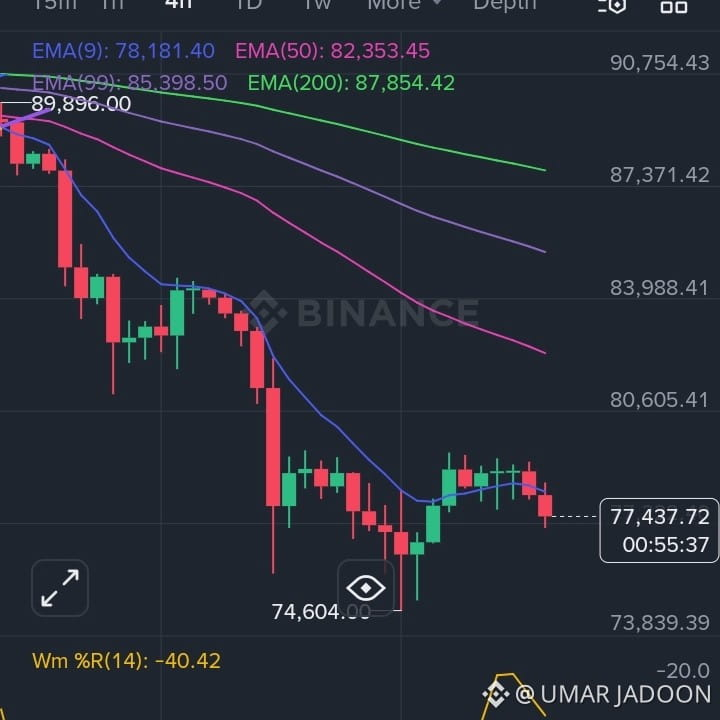
BTC is clearly trading below all major EMAs:
EMA 9 ≈ 78.1k
EMA 50 ≈ 82.3k
EMA 99 ≈ 85.3k
EMA 200 ≈ 87.8k
This alignment = classic bearish trend
Every bounce is getting sold into resistance
📉 As long as price stays below EMA 50 & EMA 200, bulls have no real control.
2️⃣ (Lower Highs + Lower Lows)
Market structure shows:
Lower high near ~83k
Breakdown to 74.6k
Weak bounce → now rolling over again near 77.4k
This confirms distribution, not accumulation
💡 Smart money is selling rallies, not buying dips.
3️⃣ (Weak Bounce = Dead Cat Bounce)
The recent move from 74.6k → 78k had:
Small candles
No strong volume
Immediate rejection near EMA 9
This indicates short-covering, not real buying demand
🐻 Bears still in control.
4️⃣ (Williams %R (~ -40)
Indicator moved from oversold → mid-range
Failed to reach overbought zone
Now turning down again
⚠️ This usually signals trend continuation downward, not reversal.
5️⃣ (Major Resistance Zones)
$BTC BTC must reclaim these to flip bullish:
78.2k → EMA 9 (short-term pressure)
80.6k → local resistance
82–83k → EMA 50 (trend invalidation level)
Until then → sell pressure remains dominant
6️⃣ (Key Support Levels to Watch)
76.8k – 77k (current weak support)
74.6k (recent swing low)
Below that → 73.8k – 72k possible liquidity zone
If 74.6k breaks, expect panic acceleration.
📌 Summary (Post-Ready)
BTC is dumping due to EMA rejection + bearish structure
No confirmation of accumulation yet
Rallies are selling opportunities, not breakouts
Trend remains bearish unless BTC reclaims 82k+
📉 Trend is your friend — until it bends