$BTC has been moving sideways, but underneath, demand is quietly shifting.
At first glance, it looks calm.Zoom in… the picture is more interesting.
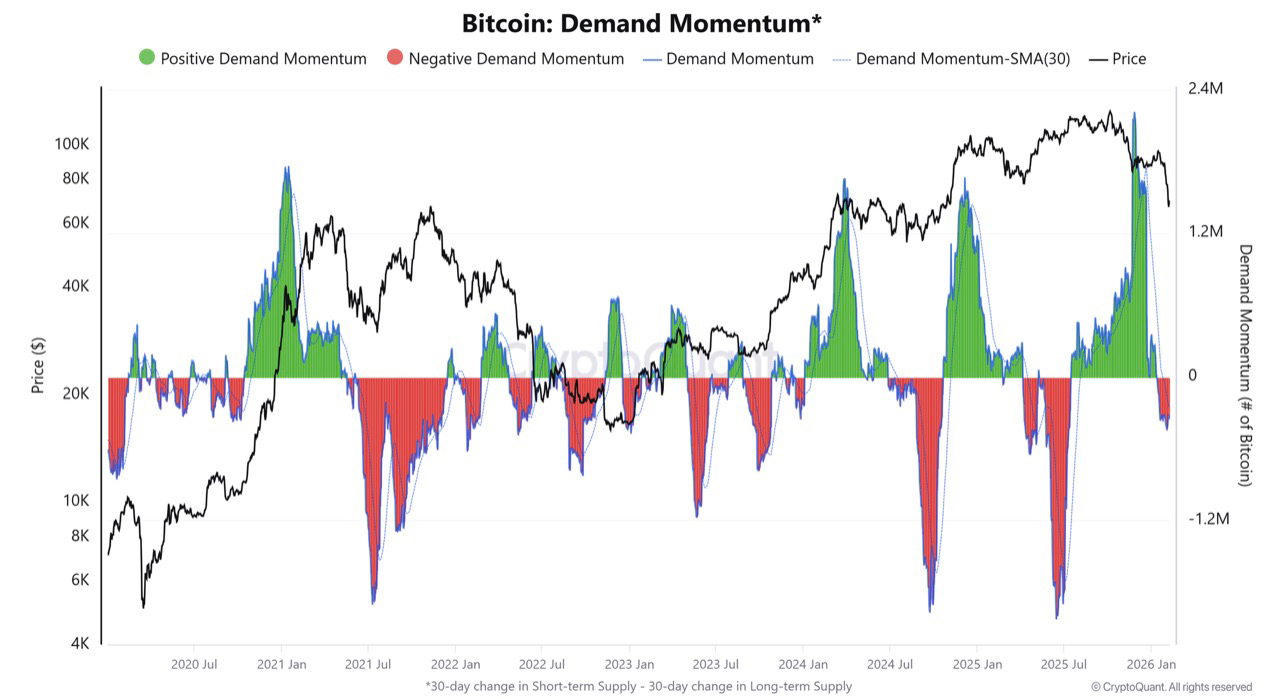
1️⃣ Momentum is flipping, not just bouncing
The 30-day demand curve rotated sharply from deep negative to strong positive.
Historically, this pattern shows up near exhaustion bottoms — not tops.It’s more about accumulation than hype.
2️⃣ Sellers are losing control
Red zones marked capitulation and forced selling.
Green spikes now show stealth buyers stepping in quietly.
This means supply pressure is fading while long-term holders absorb liquidity.
3️⃣ Structure hints at early reaccumulation
Price is compressing as momentum builds underneath.
Divergence like this often signals accumulation, not weakness.
If the structure holds, we could be seeing the early stages of reaccumulation before the next big move.
Key levels that matter
Support: 69,000
Resistance: 70,600
Why: Watching momentum helps spot when sidelined capital steps back in.
Strength signal: Clean, sustained demand above zero on the momentum line ⚡
This is not a time to chase tops.
It’s a wait-for-confirmation setup.
Smart traders react to evidence, not headlines.
