As SOL Tests Key Bid Zones
Market Snapshot
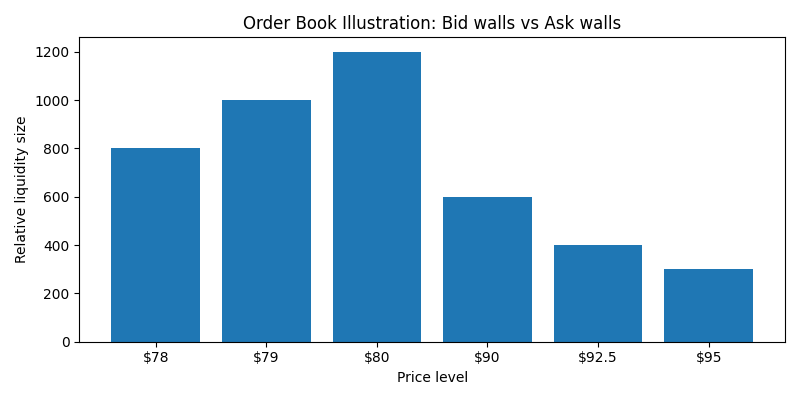
Solana is currently trading at $88.44, consolidating after a sharp corrective move. Order-book dynamics show a clear battlefield forming between resistance at $90–$95 and layered demand near $78–$80. Price action suggests compression — and compression often precedes expansions.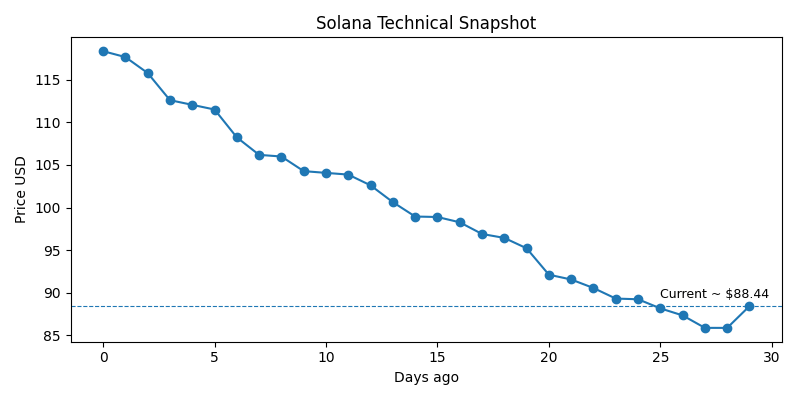
Technical Structure
Momentum Overview
Short-term bias: Neutral to slightly bearish. Price remains below short-term EMAs (9/20), indicating sellers still control immediate momentum.
Medium-term structure: Holding above major bid clusters around $78–$80 keeps base-building attempts intact.
Volatility context: Recent weeks have shown aggressive intraday swings, meaning breakout levels could trigger accelerated moves.
Indicators to Watch
EMA Alignment: A reclaim of the 9/20 EMAs would signal early bullish momentum recovery. Failure keeps pressure intact.
RSI: Recovering from oversold territory, suggesting selling pressure is cooling but not fully reversed.
MACD: Still negative, though histogram contraction hints at weakening bearish momentum.
Key Levels
Support Cluster
$80 / $79 / $78 Strong layered bid zone
A breakdown below this region would invalidate the short-term base and likely accelerate downside volatility.
Resistance Zones
$90 Immediate ask wall
$92.5 Secondary resistance
$95 Major near-term supply
A decisive reclaim above $90–$95 with volume confirmation could open a measured move toward the $120–$130 supply zone, though upside may develop gradually unless strong buying enters the market.
Bull vs Bear Scenarios
Bullish Case
Sustained close above $95
Rising volume
Bullish EMA crossover
→ Opens upside potential toward prior supply in the low $130s.
Bearish Case
Clean break below $78
Expansion in sell volume
→ Signals continuation of corrective structure and deeper retracement risk.
Fundamental & On-Chain Drivers
Network Activity: Validator stability, transaction throughput, DeFi/NFT usage continue to support long-term demand metrics.
Staking Dynamics: High staking participation reduces circulating supply, reinforcing structural support zones.
Macro Environment: Broader crypto sentiment and liquidity conditions will amplify technical breakouts in either direction.
Trading Plan Framework
Wait for confirmation above the $90 ask wall before increasing long exposure.
Place protective stops below the $78–$80 support cluster.
Use staged take-profit zones between $92 and $130 depending on breakout strength.
Treat oversold signals as preparation points, not automatic buy triggers.
Educational Takeaway
Price action around defined levels matters more than rigid predictions. Watch the reaction at $90 and $80 those zones will likely dictate the next directional expansion.