PAXG is a gold-backed crypto asset, meaning its price often reflects both crypto market behavior and gold market sentiment. On the 4-hour timeframe, PAXGUSDT Perpetual is currently trading near 5,062 USDT, providing a good case study for learning technical analysis.
🔹 Market Structure Explained
The price is forming higher highs and higher lows, which is a textbook definition of an uptrend. This tells traders that buyers are consistently willing to enter at higher prices, indicating strength in the market.
🔹 Role of the Supertrend Indicator
The Supertrend indicator remains bullish, acting as a dynamic support. As long as price stays above the Supertrend level, the broader trend bias remains upward. Beginners often use this indicator to understand trend direction and possible trend changes.
🔹 Support and Resistance Zones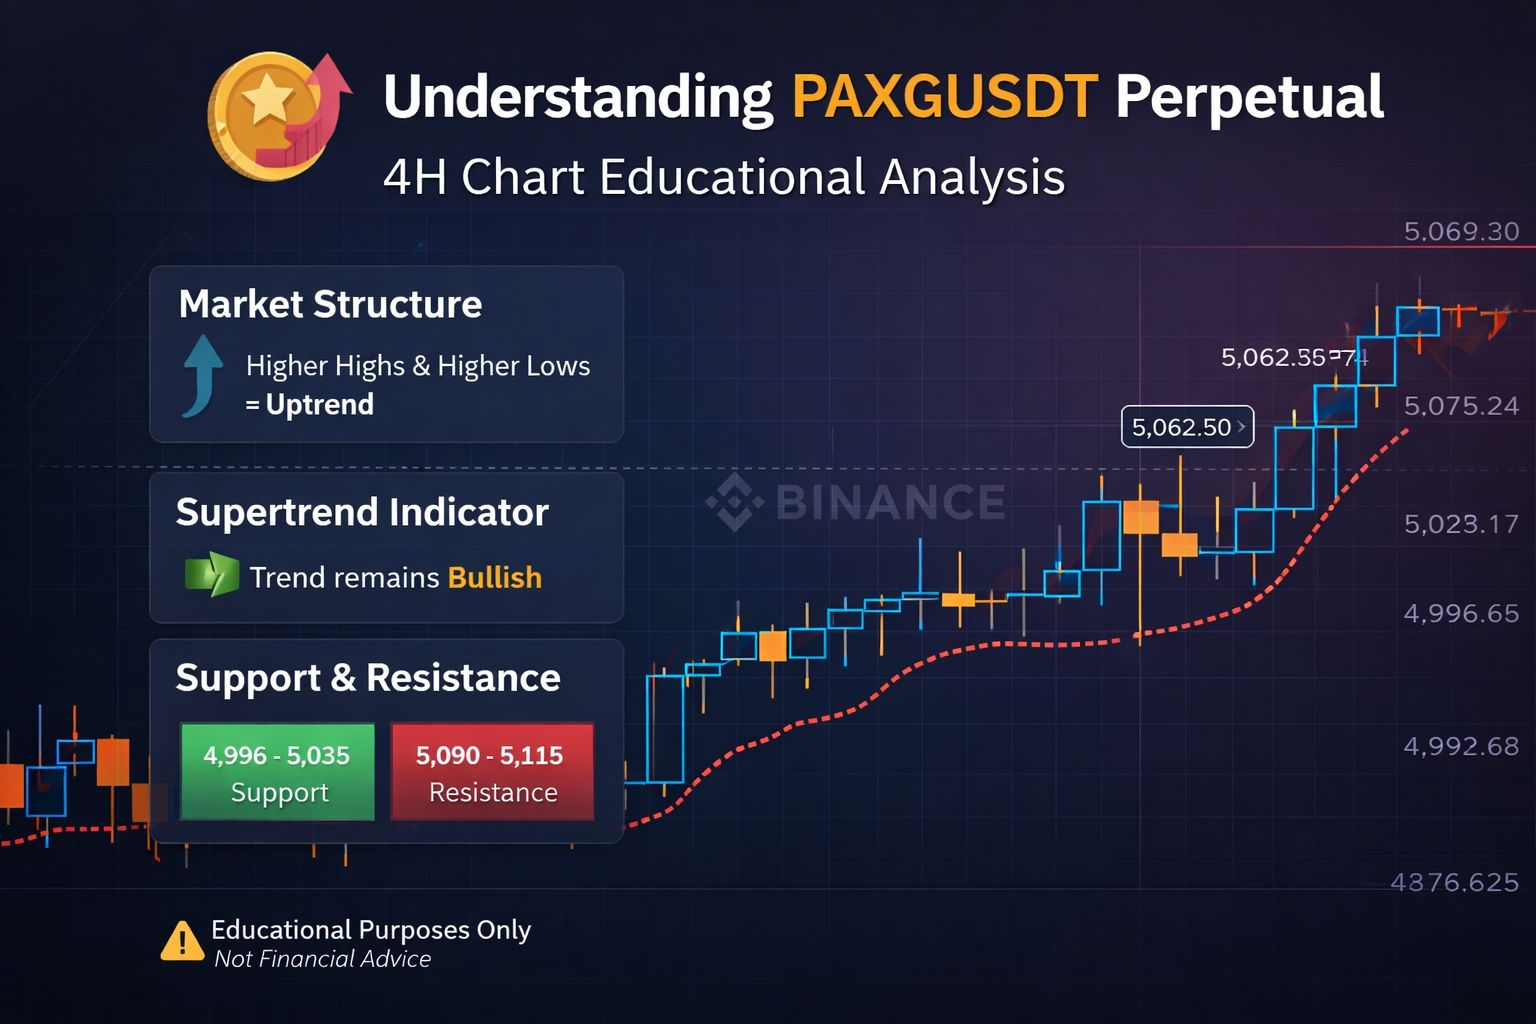
Support: 4,996 – 5,035
This zone shows where buyers previously defended price.
Resistance: 5,090 – 5,115
This area may attract profit-taking or short-term selling pressure.
🔹 Educational Takeaway
In trending markets, pullbacks are normal and healthy. A pullback toward support does not mean the trend is broken unless key levels fail. A strong close above resistance may indicate trend continuation, while rejection suggests consolidation.
📌 This article is for educational purposes only, not financial advice.
Understanding structure, indicators, and key levels helps traders make informed decisions.
#PAXG #PAXGUSDT #cryptoeducation #GoldBackedCrypt #TradingEducation #BinanceSquare