🔎 What is RSI?
The Relative Strength Index (RSI) is a momentum oscillator developed by J. Welles Wilder Jr. in 1978.
It measures:
Speed of price movement
Strength of momentum
Overbought & oversold conditions
RSI moves between 0 and 100.
⚙️ How RSI Works
RSI compares:
Average Gain (bullish candles)
Average Loss (bearish candles)
📌 Basic Formula:
RSI = 100 − [100 / (1 + RS)]
(RS = Average Gain / Average Loss)
👉 You don’t need to calculate manually — your chart does it automatically.
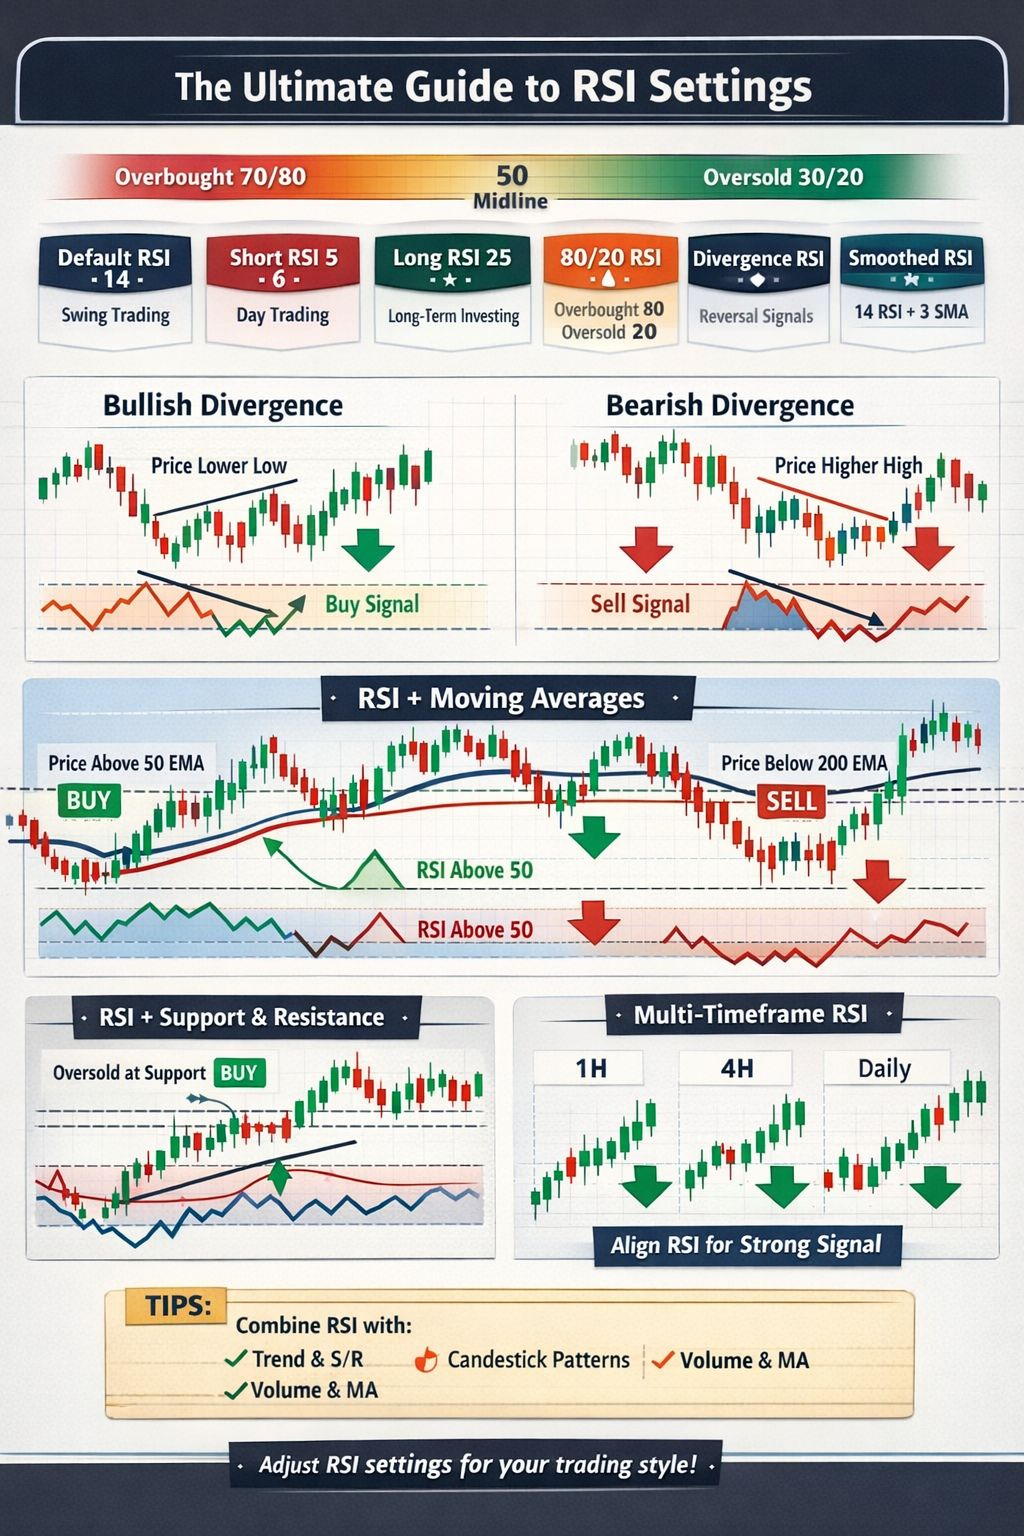
📈 Standard RSI Settings
Setting
Value
Length
14 (Default)
Overbought Level
70
Oversold Level
30
Default settings were recommended by J. Welles Wilder Jr..
🎯 RSI Levels Explained
🔴 Above 70 → Overbought
Market may be overextended
Possible pullback or correction
🟢 Below 30 → Oversold
Market may be undervalued
Possible bounce
⚖️ 50 Level → Trend Strength
Above 50 = Bullish momentum
Below 50 = Bearish momentum
🛠 Advanced RSI Settings (For Traders)
🔹 Scalping (Lower Timeframes)
RSI Length: 7 or 9
Faster signals
More fake signals
🔹 Swing Trading
RSI Length: 14 (standard)
Balanced signals
🔹 Long-Term Trading
RSI Length: 21
Smoother & stronger confirmation
🚀 RSI Trading Strategies
1️⃣ Overbought & Oversold Strategy
Buy → When RSI goes below 30 and crosses back above
Sell → When RSI goes above 70 and drops below
⚠ Works best in sideways markets.
2️⃣ RSI Divergence (Powerful Strategy)
🔥 Bullish Divergence
Price → Lower low
RSI → Higher low
Possible reversal upward.
❄ Bearish Divergence
Price → Higher high
RSI → Lower high
Possible reversal downward.
3️⃣ RSI 50 Level Strategy
In strong trends:
Buy when RSI pulls back near 40–50 in uptrend
Sell when RSI rises near 50–60 in downtrend
Very effective in trending markets.
4️⃣ RSI + Moving Average Combo
Use RSI with:
Exponential Moving Average (EMA)
Simple Moving Average (SMA)
Example: If price above 200 EMA + RSI above 50 → Strong bullish confirmation.
⚠ Common Mistakes Traders Make
❌ Selling immediately at 70
❌ Buying immediately at 30
❌ Ignoring trend direction
❌ Using RSI alone without confirmation
Remember: RSI can stay overbought in strong bull trends!
💡 Pro Tips
✔ Combine RSI with Support & Resistance
✔ Use higher timeframe for confirmation
✔ Look for confluence (trendline + RSI + volume)
✔ Avoid trading only based on one signal
📊 RSI in Crypto Market
RSI works very well in:
BTC
ETH
Altcoins
But crypto is volatile ⚡
So always use proper risk management.
🧠 When RSI Works Best
✅ Sideways markets
✅ Pullbacks in trends
✅ Reversal zones
❌ Not reliable alone during strong breakout moves
📌 Final Summary
RSI is:
Simple
Powerful
Beginner friendly
Professional level tool
If used correctly with trend + volume + key levels, it becomes very powerful.
⚠️ Disclaimer
This content is for educational purposes only. Cryptocurrency trading involves risk. Always do your own research before investing.
#CryptoEduFaisal #RSI #Binance #CryptoEarnings #BinanceSquare
