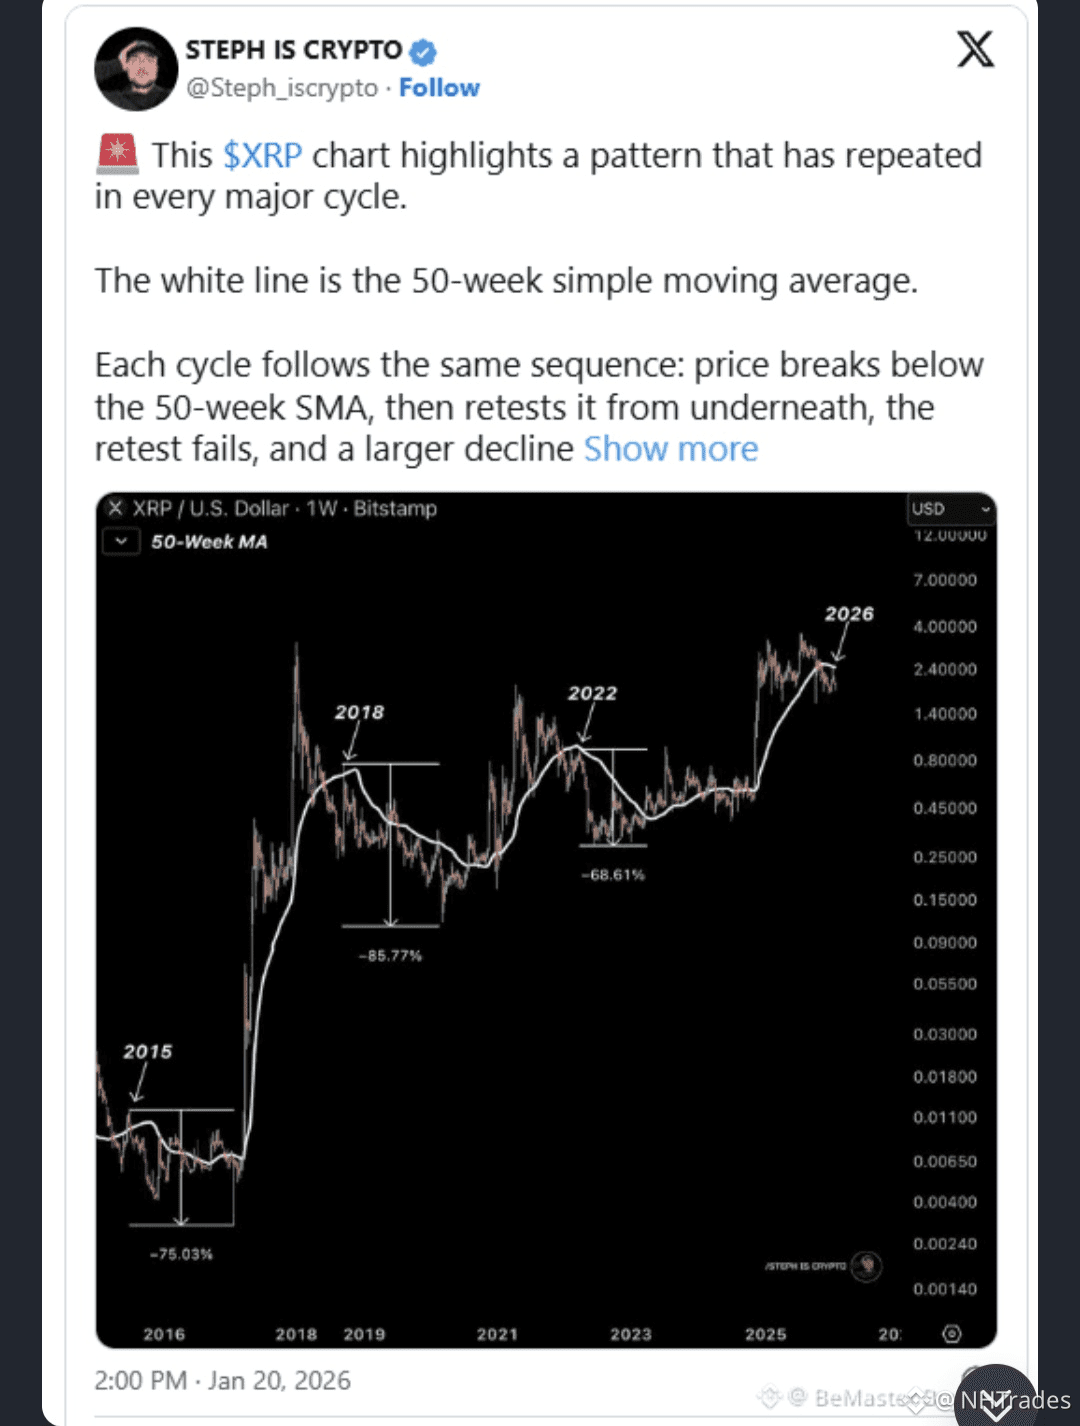
$XRP Crypto analyst Steph Is Crypto (@Steph_iscrypto) shared a chart showing how XRP interacts with the 50-week simple moving average (SMA). Spanning multiple cycles from 2015 to 2026, the chart reveals a repeating pattern in XRP’s price behavior.
📉 XRP Cycles & the 50-Week SMA
According to Steph, “When price is below the 50-week SMA, the long-term trend turns bearish, and the SMA becomes resistance.” Historically:
2015: XRP dropped 75% after failing SMA support.
2018: XRP fell 85% once it broke below the SMA.
2022: XRP declined 68% in a similar pattern.
This weekend, XRP dipped from $2 → $1.84, hinting the trend may be repeating.
💹 Recent Price Action
Currently, XRP trades at $1.89. After a brief resurgence in early January, it failed to reclaim the 50-week SMA, mirroring previous cycles where the SMA acted as strong resistance. The chart shows repeated retests of the SMA leading to extended declines, confirming its importance as a market indicator.
🔮 Where Could XRP Go Next?
Using historical cycles as a guide:
Past declines after SMA failures ranged 68–85%.
This would place XRP’s potential target between $0.59 and $0.27, levels last seen in late 2024 and early 2021.
While this isn’t a guaranteed prediction, the 50-week SMA remains a key indicator for XRP’s next move. If XRP fails to recover, history suggests a possible repeat of these steep declines.
💡 Takeaway: The 50-week SMA is critical for tracking XRP cycles. Consistent patterns across multiple years show: failing the SMA → unsuccessful retest → major drop.
🚀 FOLLOW BeMaster BuySmart 💰 TO STAY UPDATED! 🚀
Appreciate the support! 😍👍
#XRP #CryptoAnalysis #CryptoTrading #Altcoins #XRPPrice #BeMasterBuySmart #CryptoTrends #SMA #TradingSignals #CryptoInvesting
