Following a strong rally to a local peak of $0.03173, the $ESIM price is currently undergoing a significant correction on the 4-hour timeframe.
Key Technical Indicators:
Price Action: The asset is trading around $0.02394, marking a >10% drop in the last 24h. It is currently retesting the previous major breakout support zone between $0.022 - $0.024.
MACD: Signals a clear bearish trend. The MACD line has crossed below the signal line, and the red histogram is expanding downward, indicating increasing negative momentum.
RSI (14): The Relative Strength Index has cooled off significantly from overbought territory down to ~42.89, indicating a neutral-to-bearish sentiment in the short term.
Summary:
Short-term momentum is undeniably bearish as the market digests recent gains. However, the price is currently sitting at a critical structural support level. For long-term investors, this pullback represents a potential stabilization zone after an overheated rally.
#ESIM #DePIN #TechnicalAnalysis 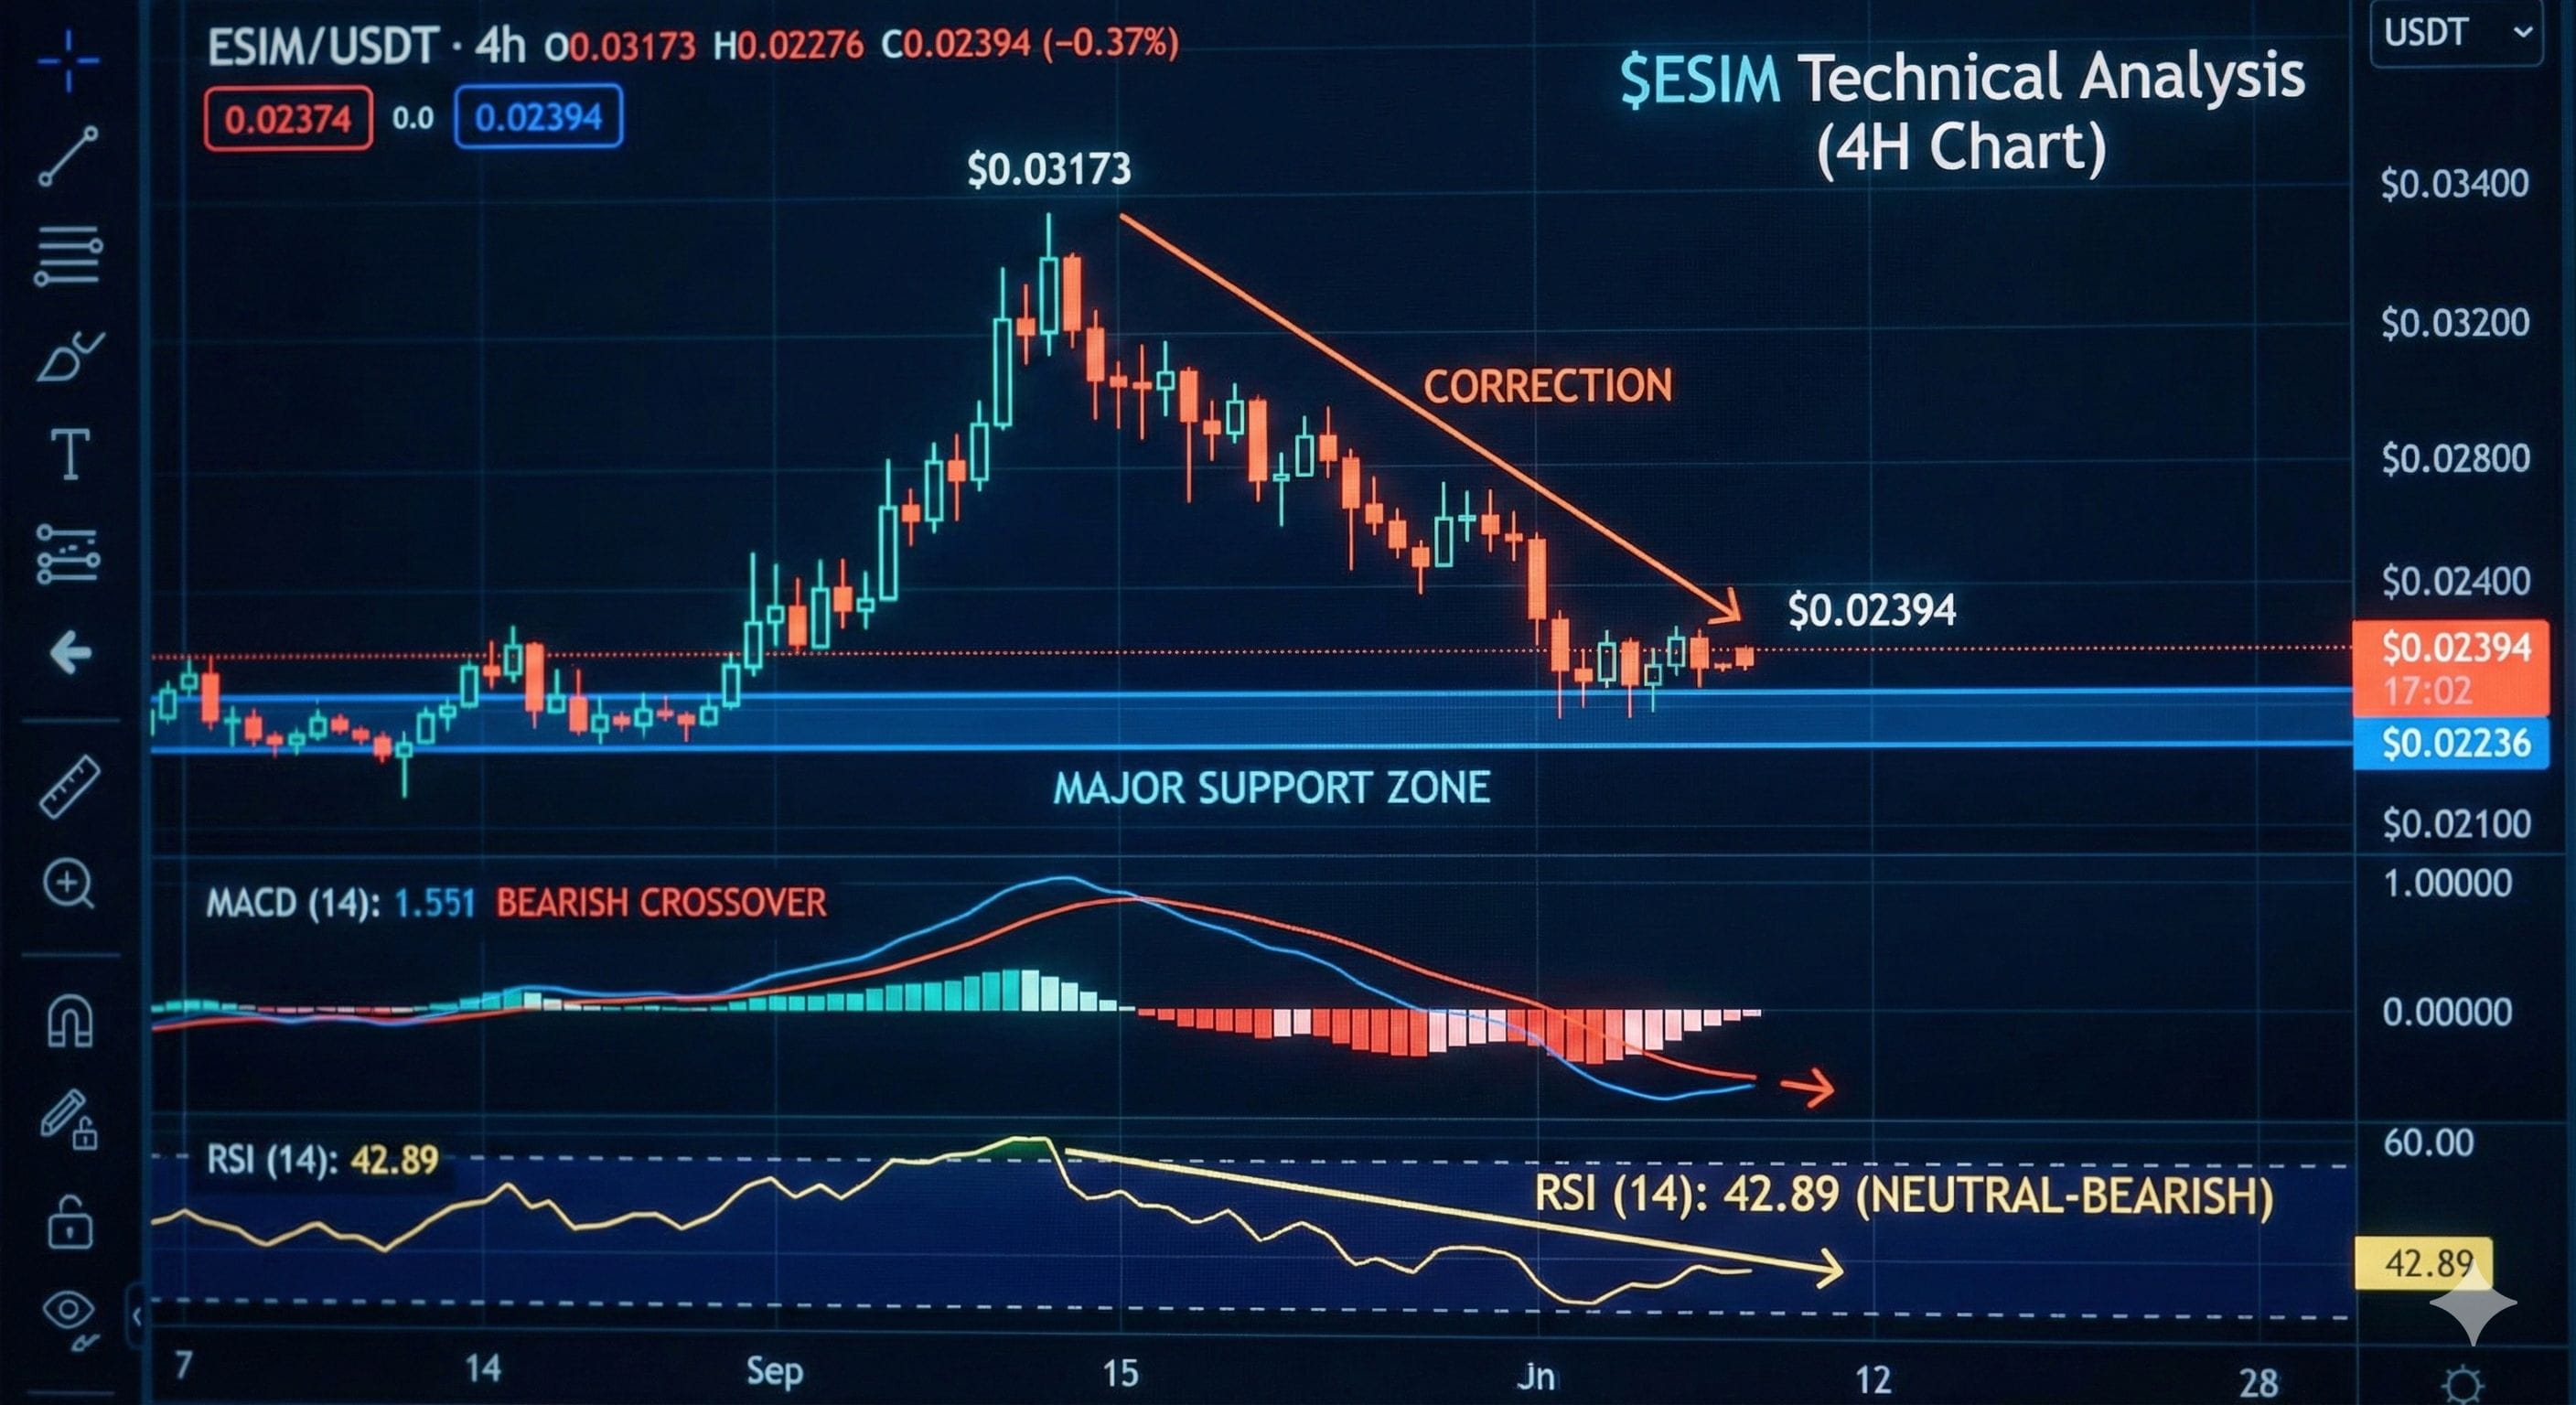 #DYOR
#DYOR