$BTC Here’s a latest detailed Bitcoin analysis (with pictures) — covering current price action, technical view, macro drivers, sentiment, and near-term forecasts (January–March 2026) based on the most recent market data and expert commentary.
📉 Current Market Snapshot (Jan 2026)
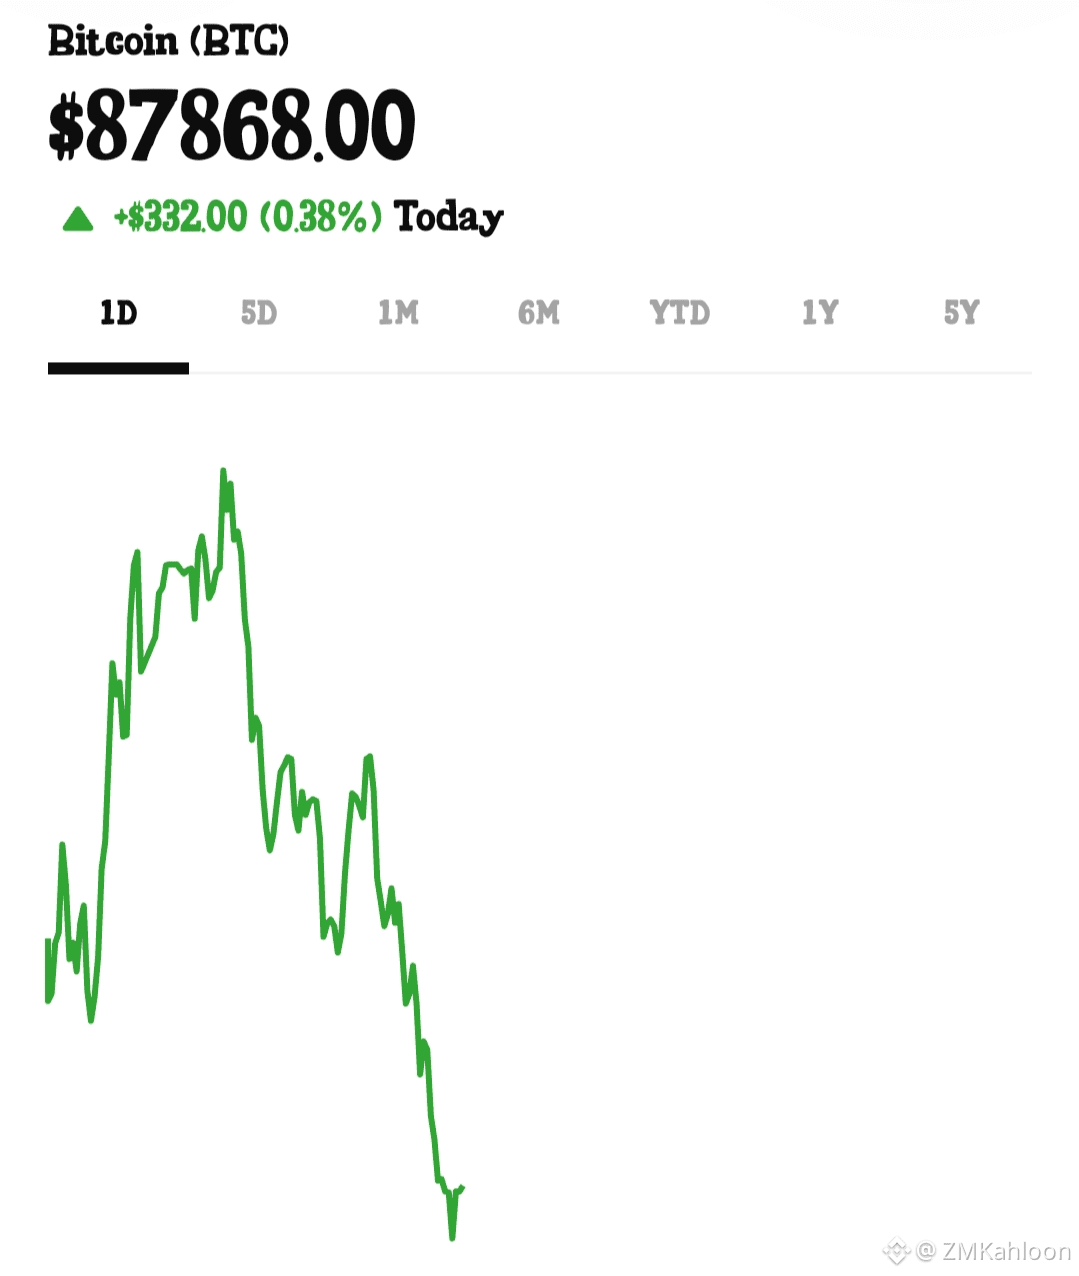
🟡 Price Action
Bitcoin has recently hovered near ~$88,000–$90,000, with volatility still elevated. Markets have been range-bound, trading between key support and resistance zones. �
Cryptonews +1
Some reports show price pressure due to macro uncertainty, while others highlight stabilization and cautious positioning ahead of major catalysts like U.S. Fed policy decisions. �
IG +1
🔵 Recent News Signals
Mixed sentiment with short-term losses and recovery attempts seen throughout January. �
Eudaimonia and Co +1
Institutional interest still relevant, but ETF flows have seen periods of outflow, weighing on price near key levels. �
forbes.com
🧠 Technical Analysis (Chart Structure)
🎯 Key Levels to Watch
Support: ~$84,000–$86,000 — critical zone to hold for price stability. �
MEXC
Resistance: ~$92,000–$96,000 — break above here could trigger more bullish momentum. �
FX Leaders
Breakout Trigger: A sustained move above ~$96,600–$100,000 can signal medium-term trend reversal. �
MEXC
📊 Chart Observations
Price has been showing range trading, with short-term oscillations between support and resistance. �
FX Leaders
Technical indicators like RSI and MACD suggest consolidation rather than strong trend — which aligns with mixed short-term trading signals. �
MEXC
If BTC breaks below immediate supports, the next downside target could trend toward ~$80,000. �
MEXC
📈 Near-Term Price Forecasts
Here’s how analysts are framing the next few weeks (Jan–Mar 2026):
🟢 Bullish Scenario
Short-term targets between $92,000–$98,000 if resistance breaks. �
MEXC
Intermediate medium target around $110,000+ if momentum intensifies and institutional inflows resume. �
MEXC +1
🔴 Bearish Risks
If price breaks below key supports, BTC could retest $80,000 area. �
MEXC
Continued macro stress, weak equity markets, or ETF outflows could keep buying pressure subdued. �
forbes.com
📌 Example forecast ranges from models:
Short-term range: $85,000 – $92,000 (range bound) �
FX Leaders
Next medium term: $94,000 – $102,000+ if bullish breakout holds. �
MEXC
🌍 Macro Drivers & Fundamentals
📊 Institutional Demand
Spot BTC ETFs and institutional players continue shaping liquidity and flows. Outflows recently slowed but have influenced price structure. �
forbes.com
📉 Market Sentiment
Fear & Greed Index and social sentiment remain cautious — often contrarian signals that can precede trend reversals. �
AInvest
🔄 Broader Macro Conditions
U.S. Federal Reserve policy expectations and global risk aversion are major external factors — stronger dollar or hawkish rates typically weigh on BTC. �
IG
🧑💻 Summary: What This Means
Aspect
Current View
Short-Term Trend
Range-bound / mixed signals
Support Levels
$84,000–$86,000
Resistance Levels
$92,000–$96,000
Bullish Breakout Target
$100,000+
Bearish Risk
$80,000 area or below
Conclusion: BTC is in a consolidation phase with medium confidence for upside if key resistance levels are cleared. Bearish scenarios remain viable if breakdowns occur or macro risks intensify.
🧠 Trading & Risk Notes
📌 Always use risk management: crypto markets are volatile. Supports can fail quickly, and false breakouts are common. Indicators like RSI and moving averages should be combined with news catalysts before taking positions.
📌 Long-term investors should look beyond short noise — Bitcoin’s structural narrative (scarcity, ETF demand, adoption) underpins potential future growth, even if short runs are choppy. �
AInvest
Would you like the latest live BTC price chart and key indicator readings (RSI, MACD, moving averages) updated right now? (I can pull that live for you.)$BTC