$BTC Here’s a latest Bitcoin (BTC) price analysis and outlook as of January 29, 2026 — covering current price action, technical trends, macro influences, and future forecasts, with visuals to help you understand the market context.
📊 Current Price & Market Sentiment
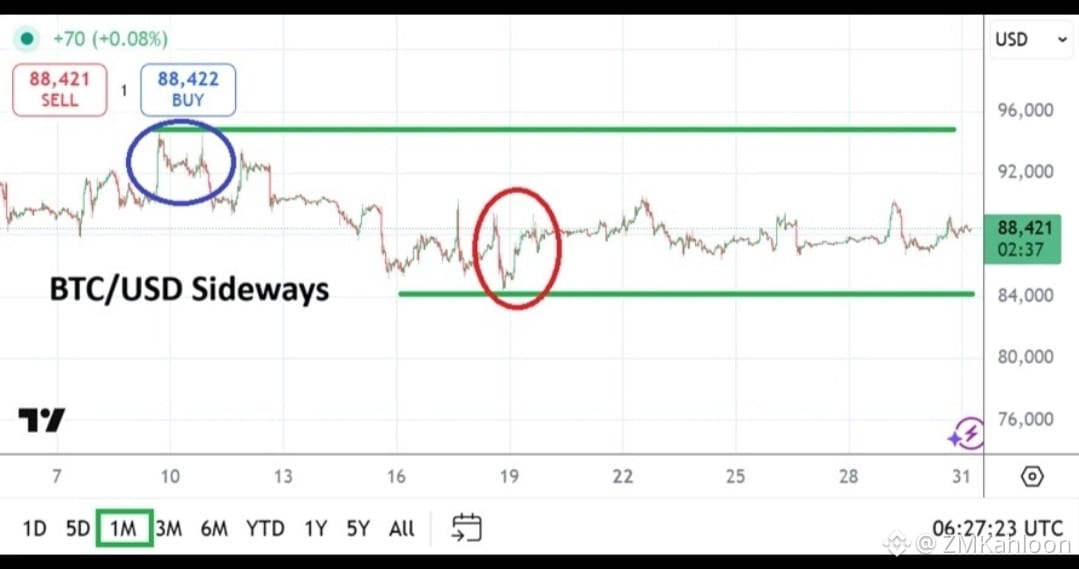
BTC is trading near ~$88,000–$89,000 at the end of January 2026 — a key psychological zone. �
The Economic Times +1
This price level has acted as both support and resistance multiple times in recent weeks. �
StatMuse
Volatility remains elevated, with price swings reflecting broader market uncertainty and rotation between risk assets and traditional safe havens like gold. �
barrons.com
Interpretation: BTC is neither in a clear bull trend nor deep bearish collapse — it’s currently consolidating, which is typical after a prolonged rally. Traders are watching key support and resistance levels closely.
📉 Technical Outlook (Short-Term)
Bullish Signals
Analysts see potential for a rebound toward $95,000+ if BTC breaks above the immediate resistance around $90,000–$92,000. �
MEXC
RSI and MACD indicators could turn bullish if volume increases and BTC holds above $90K. �
MEXC
Bearish Risks
A breakdown below $84,000–$80,000 could signal deeper correction pressure. �
MEXC
Macroeconomic risks — like weak ETF flows and risk-off sentiment — have already weighed on BTC. �
The Economic Times
Key Technical Levels to Watch
Level
Significance
Support ~ $88K
Short-term base of consolidation
Support ~ $84K–$80K
Stronger downside buffer
Resistance ~ $92K–$95K
Breakout trigger
Higher resistance ~ $104K+
Longer-term bullish target
🌍 Macro & Sentiment Influences
ETF flows are weak, limiting institutional capital inflows. �
The Economic Times
Gold has been outperforming BTC recently, attracting safe-haven demand in times of global uncertainty. �
barrons.com
Geopolitical tensions and market rotations impact BTC’s trend as traders balance risk vs reward. �
theguardian.com
What this means: Bitcoin’s price is being shaped by both crypto-specific drivers and broader market macro dynamics — similar to commodities and risk assets.
🔮 Price Predictions & Forecasts
📈 Bullish Scenarios
Some models project BTC could target $95,000 by February 2026 if momentum improves. �
MEXC
Longer-term bullish forecasts (2026 overall) suggest potential targets from $120K up to $170K with broader adoption and capital inflows. �
IG
More aggressive analysts even consider a mid-cycle peak above $200,000 if liquidity and demand surge. �
CryptoRank
📉 Bearish Scenarios
If volatility persists and support breaks, average 2026 price could range lower — some analysts see mid-year downside toward $70K–$80K. �
KoinX
Consensus Summary (Analyst Range):
Bearish: ~$70K–$90K
Neutral to Bullish: ~$90K–$120K
Optimistic: ~$120K–$200K+
All forecasts are projections, not financial advice.
🧠 What Traders Are Watching Now
RSI / MACD signals on daily & weekly charts for trend shifts
Volume and ETF inflows/outflows for external demand signals
Key support zones ($84K–$88K) — losing these could shift momentum
Breakouts above $92K — bullish continuation trigger
📌 Your Takeaways
BTC is in a consolidation range, not a full bull rally or crash.
Technical and macro factors are equally influencing price action.
The near term is range-bound, but market catalysts (ETF flows, global liquidity, adoption) could tip direction.
Would you like a live Bitcoin price chart snapshot or a trading strategy breakdown (bullish vs bearish playbooks)?$BTC