Market Structure Overview
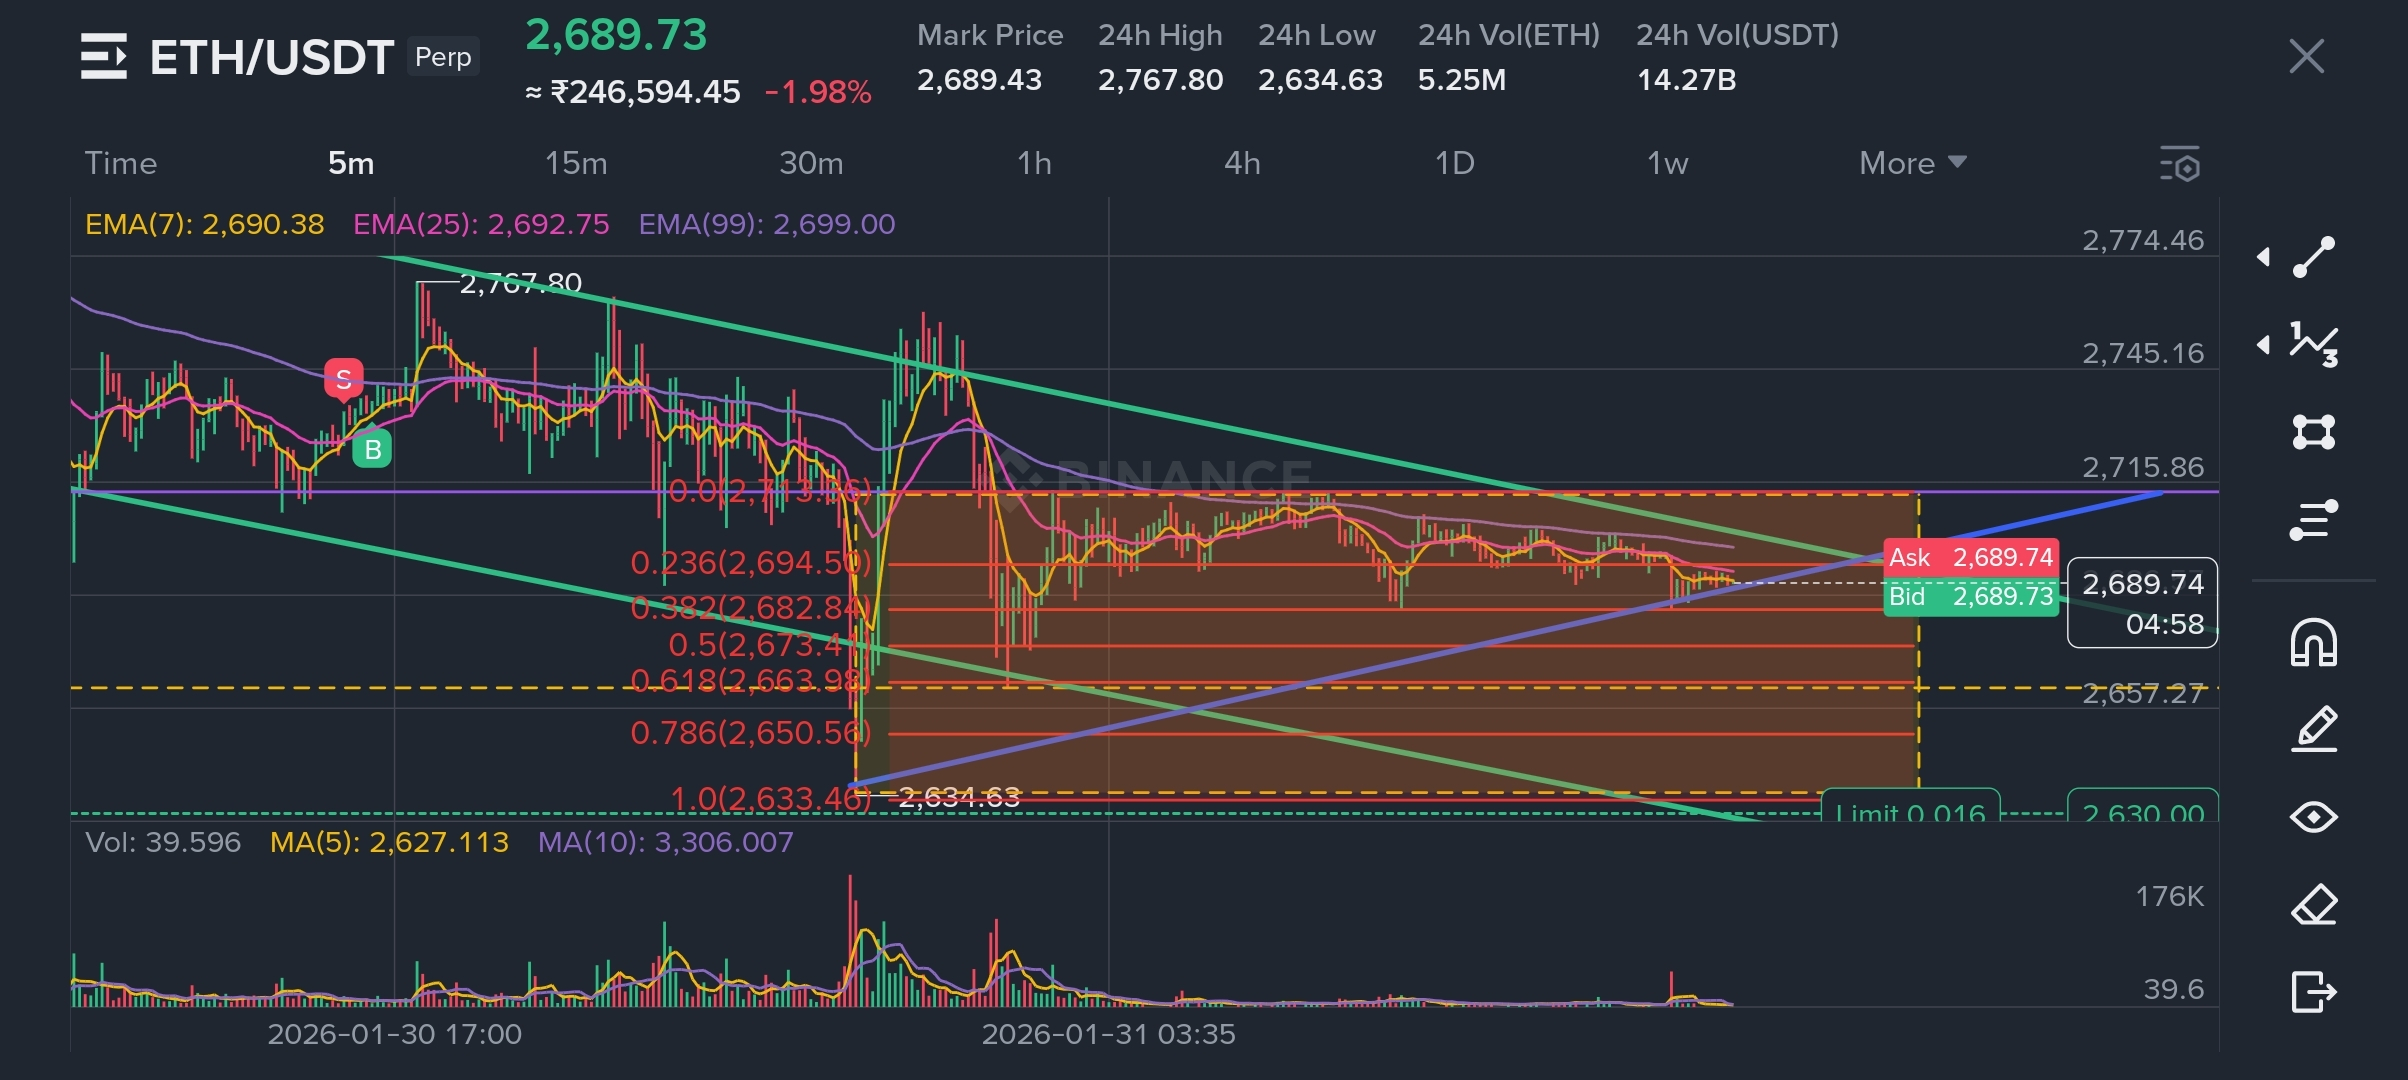
$ETH Ethereum is currently trading inside a compressed liquidity zone after a broader corrective phase from the 2,760–2,780 supply region. The current price action suggests volatility contraction, typically seen before directional expansion.
From your chart structure:
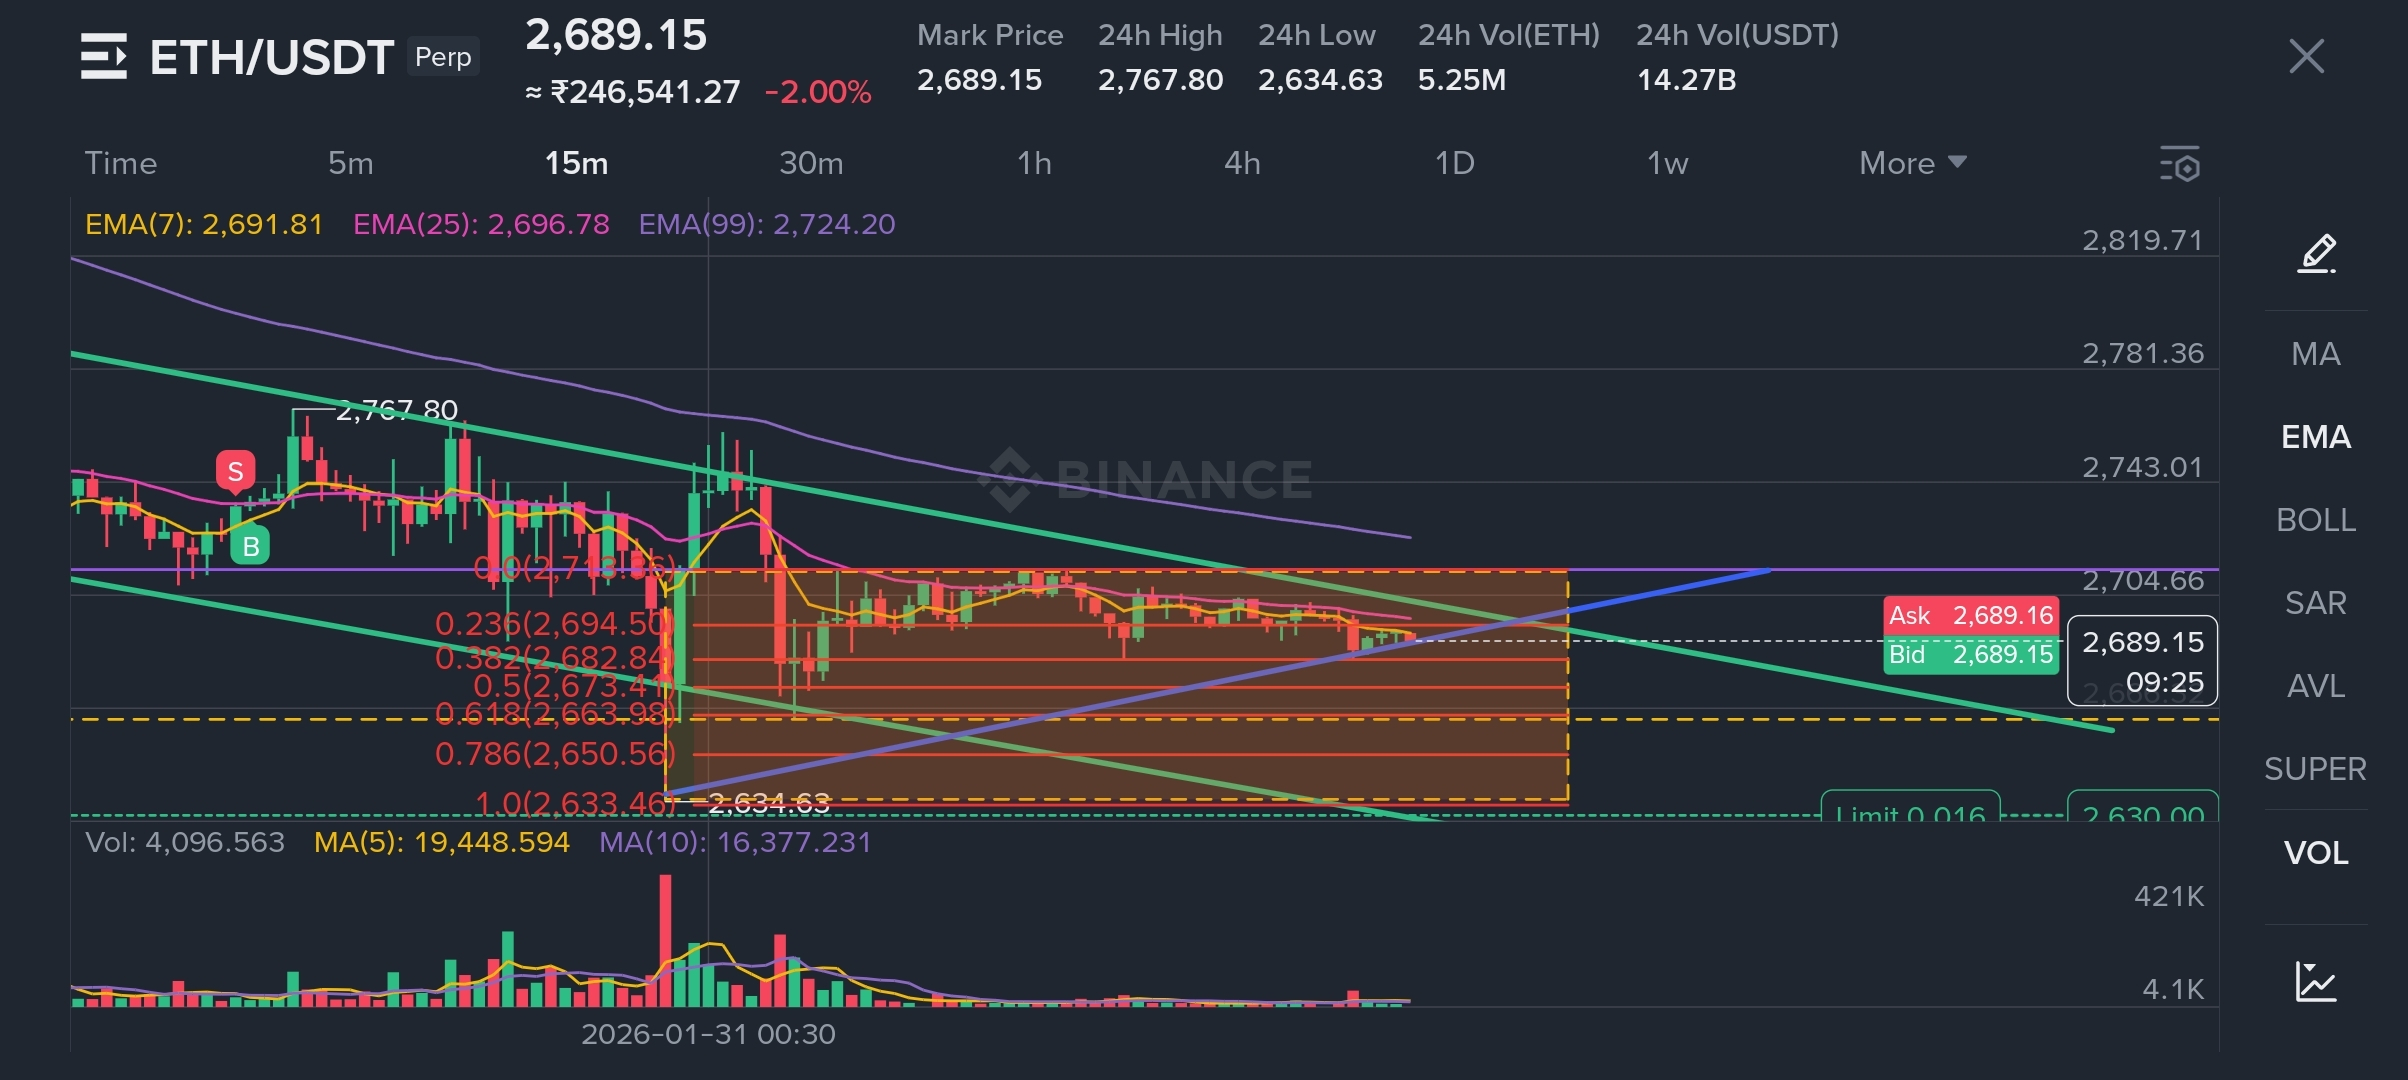
Descending macro resistance channel still active
Local ascending support trendline forming short-term structure
Fibonacci retracement cluster forming high-probability reaction zone
EMA cluster flattening → momentum neutralizing
This structure usually represents institutional accumulation OR distribution before expansion.
💹Trendline & Structure Interpretation
🔴 Macro Bearish Pressure
upper descending channel indicates:
Sellers defending premium liquidity zones
Lower highs structure still technically intact
Unless ETH reclaims upper channel resistance, macro pressure remains.
🔵 Short-Term Structural Support (Blue Line)
Ascending blue support trendline shows:
Dip buyers active
Liquidity defense zone forming
Potential spring setup if breakdown fails
This is classic range compression before breakout behavior.
🟧 Fibonacci Liquidity Zone (Orange Cluster)
Key Levels:
0.236 → Early resistance flip zone
0.382 → Reaction / scalp reversal zone
0.5 → Market equilibrium (decision level)
0.618 → Smart money entry zone
0.786 → Last defense before structural breakdown
Currently ETH hovering near mid-range → indecision phase.
EMA Momentum Read
EMA7 < EMA25 ≈ EMA99 flattening
Meaning:
Short term momentum weak
Trend transition phase
Awaiting catalyst event
🌍 Macro & International Market Context
Recent global crypto developments supporting consolidation thesis:
Proposed crypto regulation draft suggests some major altcoins may receive classification clarity if included in ETF structures.
Institutional adoption trend increased after ETF approvals — crypto now behaves more correlated to equities than before.
This explains:
👉 Why crypto now respects macro liquidity cycles more
👉 Why range trading phases last longer
📉Market Sentiment Snapshot
Recent market data indicates:
Neutral Fear & Greed environment
Bitcoin dominance still strong
Altcoins not in full expansion cycle
(Neutral sentiment markets usually produce fake breakouts before real moves.)
🐋 Whale & Smart Money Behavior
Current signals suggest:
Passive accumulation inside volatility compression
Liquidity sweep attempts likely both sides
Stop hunt probability high before real move
Institutions prefer:
✔ Break retail trendline
✔ Trigger liquidations
✔ Then push real direction
📈 Probable Scenarios
Bullish Expansion Case
Trigger:
Reclaim upper channel
Hold above Fib 0.5
EMA7 cross EMA25 upward
Targets:
Liquidity pocket near previous distribution zone
Momentum continuation if volume expansion follows
📉Bearish Expansion Case
Trigger:
Lose blue ascending support
Close below Fib 0.786
Volume spike on breakdown
Targets:
Lower liquidity void
Panic selling cascade
⚡Scalper Strategy Zone
Long Scalp Setup
Look For:
✔️Wick rejection lower Fib levels
✔️Volume spike absorption
✔️Fast EMA crossover
Short Scalp Setup
Look For:
✔️Fake breakout above Fib mid
✔️Low follow-through volume
✔️Rejection candle near channel resistance
TAGS:
#ETHUSDT #CryptoTrading #TechnicalAnalysis #SmartMoney #CryptoMarkets