1️⃣ Asian session range built
Price was ranging roughly between $GPS
0.00829 – 0.00865
This range created equal highs / resting liquidity on top
Volume was low → typical Asia accumulation
👉 This is where smart money waits, not moves.
2️⃣ London session = Liquidity sweep
During London open, price pushed above range highs
That move took buy-side liquidity (stops of short sellers + breakout buyers)
The spike to ~0.00906 is a classic liquidity grab, not random pump
✔️ Sweep confirmed because:
Took previous highs
Quick reaction after sweep
No strong continuation candle yet
3️⃣ Bollinger Bands confirmation
Price expanded to upper Bollinger band
After sweep, candles start to stall near upper band
This often means:
Either small pullback
Or re-accumulation before next push
Your green trendline = bullish structure
Liquidity sweep happened in premium zone
This means:
Short-term profit-taking possible
But overall bias still bullish unless structure breaks
5️⃣ MACD & Momentum
MACD histogram turning green
DIF above DEA → bullish momentum
BUT momentum is slowing near highs → typical after liquidity sweep
What smart traders do here (important)
Scenario A: Healthy continuation
If price:
Pulls back to 0.00865 – 0.00850
Holds above mid Bollinger band
Volume decreases on pullback
👉 That’s re-accumulation 👉 Next target: 0.00920 – 0.00950
Scenario B: Fake breakout (London trap)
If price:
Breaks below 0.00850
Closes under Asian high
👉 Then London used liquidity to distribute 👉 Price may revisit 0.00830 liquidity
Key liquidity levels for you
🟦 Buy-side liquidity taken: ~0.00900 – 0.00906
🟨 Re-entry demand zone: 0.00850 – 0.00865
🔴 Invalidation: Below 0.00829
🎯 Next liquidity pool: Above 0.00920+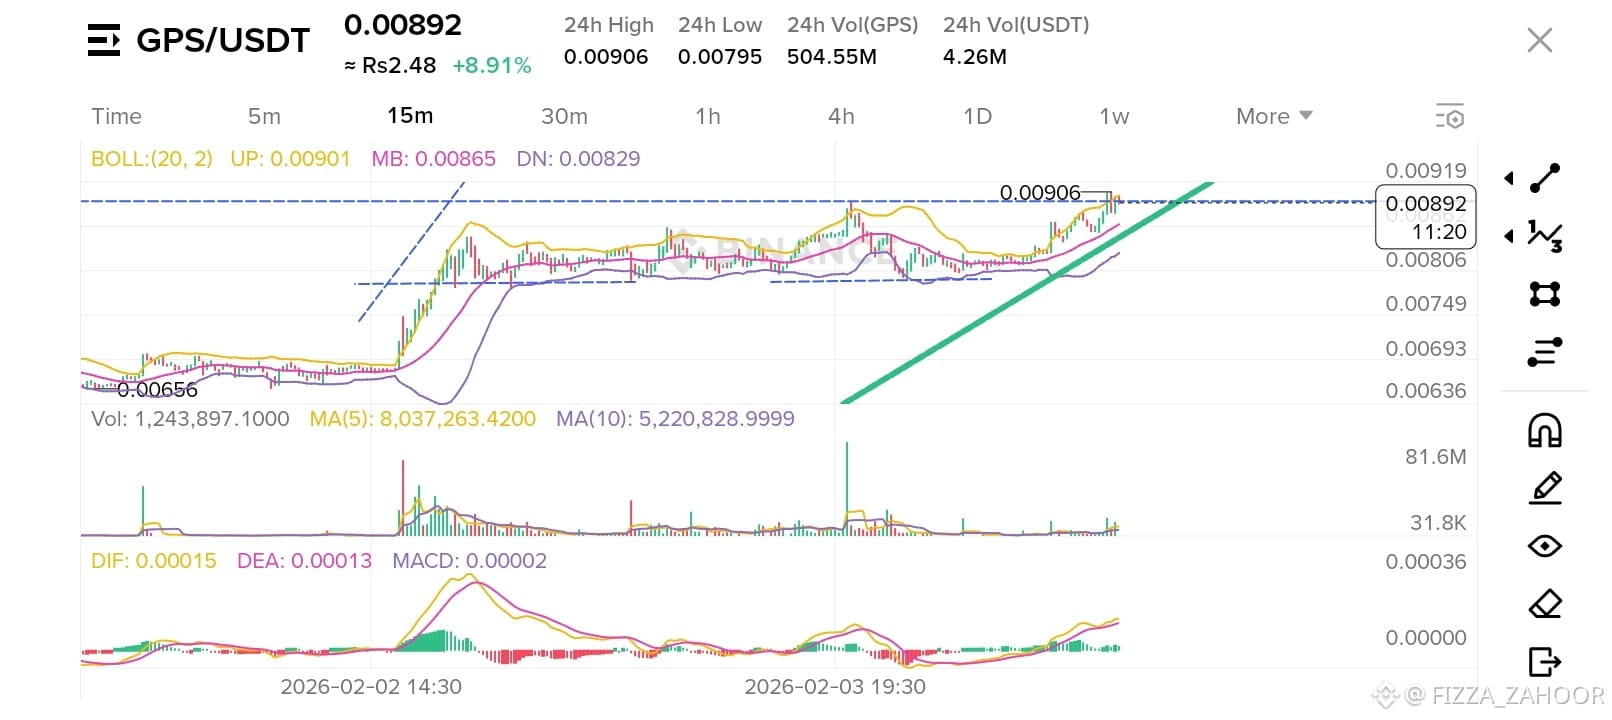
#StrategyBTCPurchase #USIranStandoff #GoldSilverRebound #bullish #GPS