To survive in the crypto markets, you must understand Price Action. Currently, $ETH is providing a textbook example of a bearish market structure.
Market Structure Analysis:
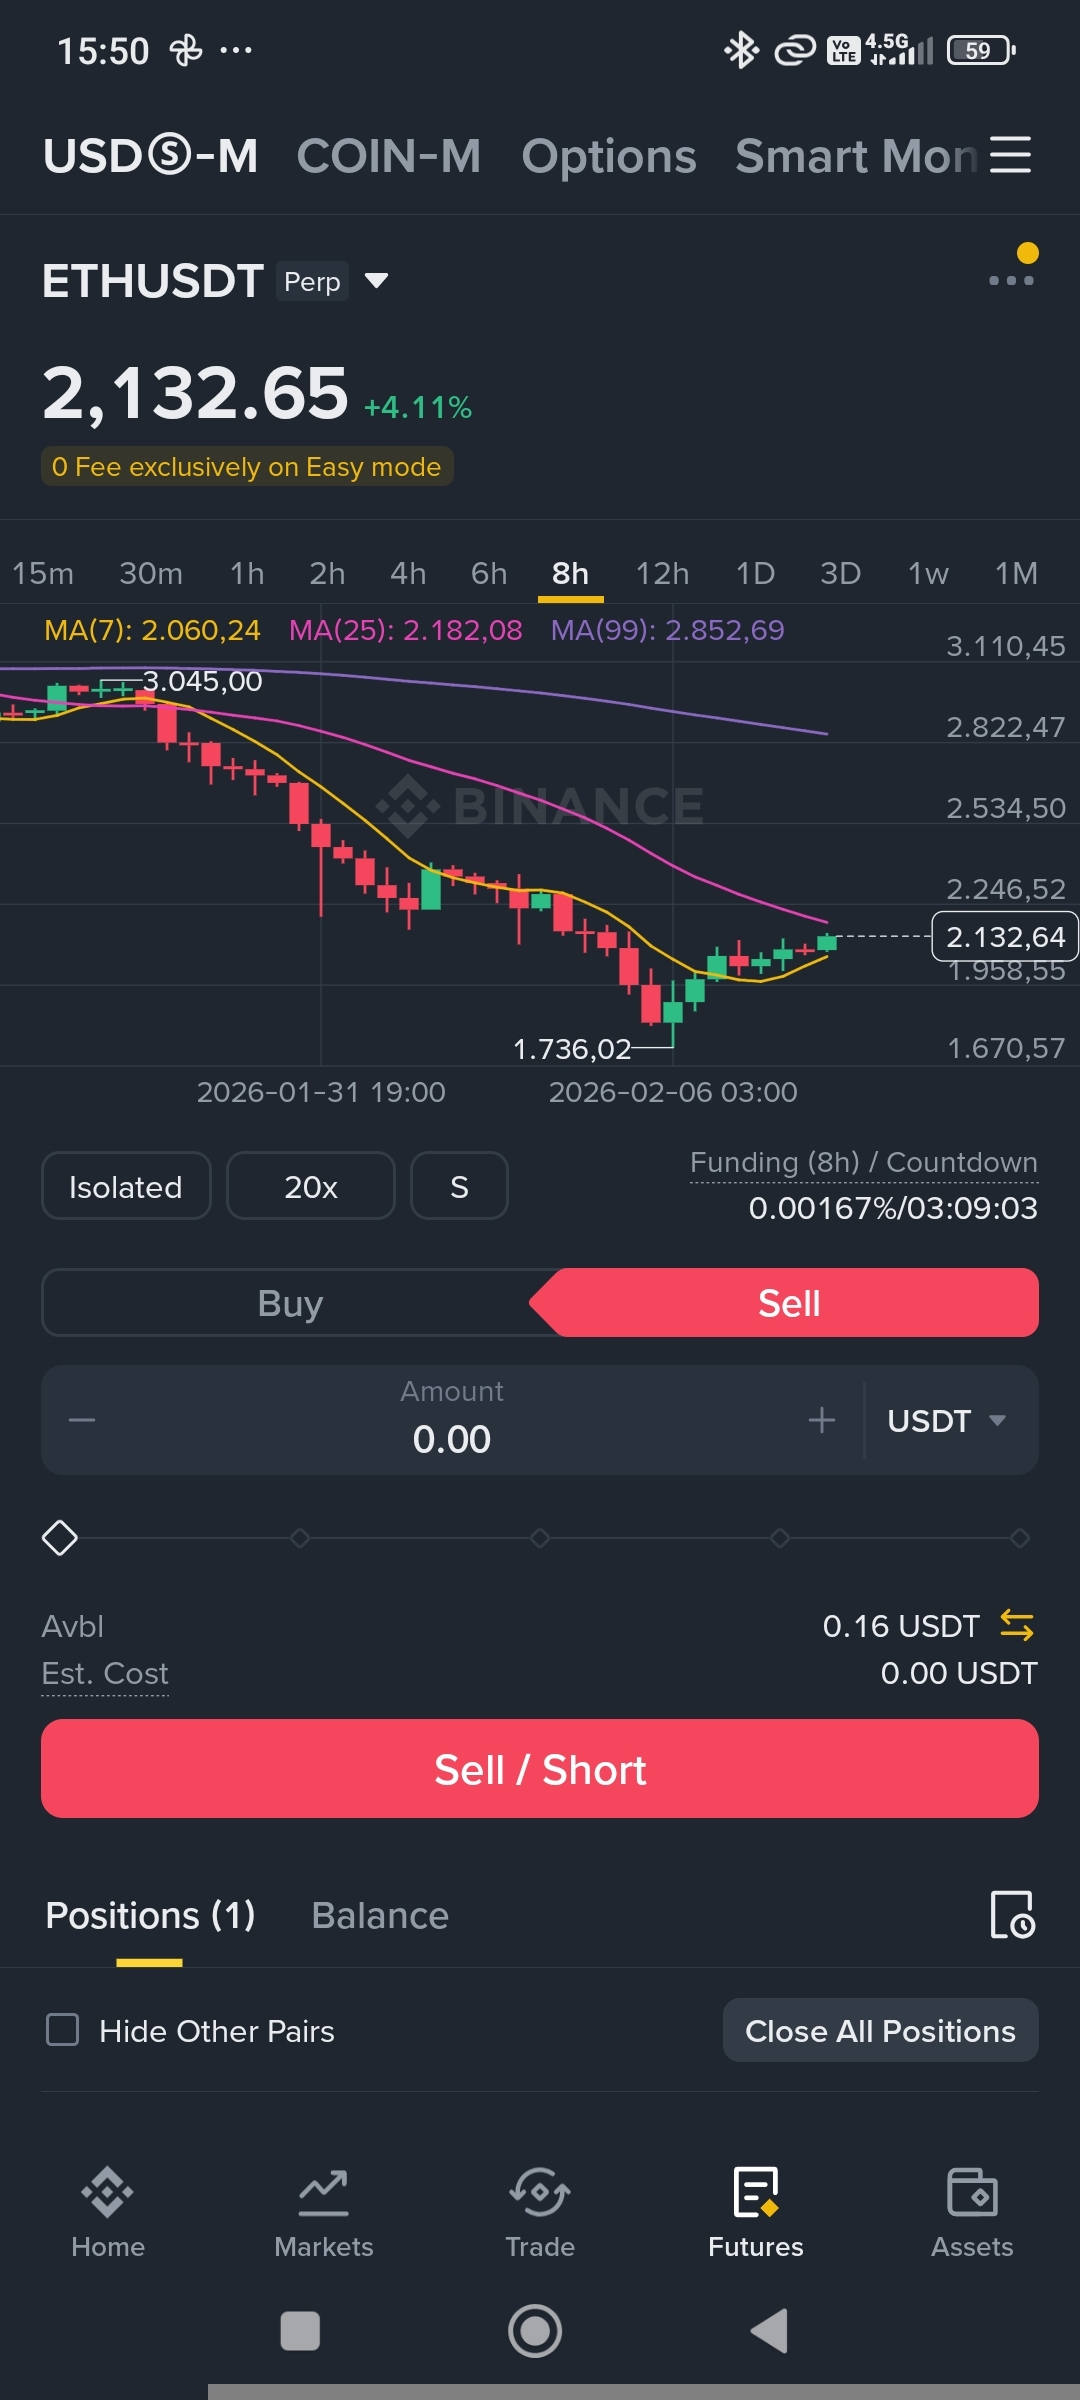
Despite the recent local bounce to $2,139.98, the higher timeframe (HTF) still shows a sequence of 'Lower Highs' and 'Lower Lows'. We are currently in a 'Relief Rally' phase, testing the strength of the sellers.
Technical Breakdown:
The S/R Flip: The zone around $2,200 used to be a strong support; now it has flipped into a major resistance.
Moving Average Confluence: The MA(99) at $2,196.63 is acting as a 'Dynamic Resistance'. As long as the price remains below this level, the bearish bias remains intact.
Momentum Check: While price is above MA(7) ($2,100) and MA(25) ($2,063), this is often seen as a 'Bull Trap' before the next leg down.
My Strategic Execution:
I am holding my Short position from $2,326.48. My discipline is simple: Trust the trend, not the noise. > * Liquidation Safety: Positioned at $2,431.26, well above the current structural resistance.
Target Zone: Looking for a liquidity grab near the $1,800 level.
Expert Tip: In a downtrend, every bounce is a potential shorting opportunity until a 'Market Structure Shift' occurs. Don't chase the green candles! 🚫🟢
Are you watching the $2,196 resistance or expecting a breakout? Drop your analysis below! 👇$ETH
#ETH #priceaction #tradingStrategy #bearmarket #writetoearn