Solana (SOL) — Support & Resistance Analysis
Here’s a short technical-analysis overview of Solana (SOL), focused on key support and resistance levels and what to watch. This is not investment advice.
🔍 Current Technical Landscape
The price of SOL is around US$153 (at time of writing).
According to an analysis by altFINS, SOL is in a downtrend, trading in a “channel-down” pattern and showing bearish momentum in the short term.
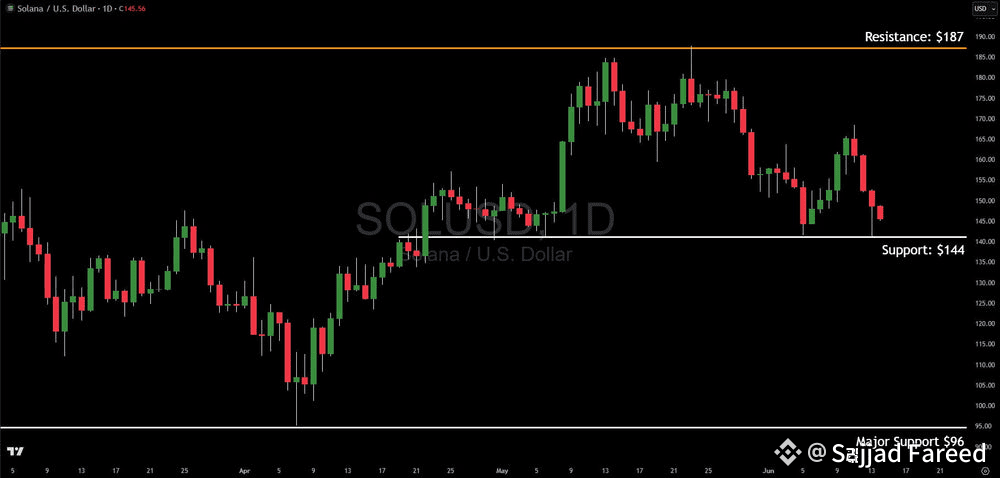
Recently, according to CoinDesk, SOL broke below a key support zone around US$156, which raises the risk of further downside unless that zone is reclaimed.
🛡️ Key Support Levels
Primary support near US$152.80 zone — this was recently tested as SOL broke below US$156 and pulled back into this area.
Additional support levels around US$150, and then US$145 if the breakdown deepens.
From a broader perspective, some analysts list supports at US$148.58, US$142.84 and US$131.37.
Interpretation: If price holds near ~US$150-153, that could serve as a base for a rebound. If it fails, the next significant support is ~US$145 or even lower ~US$131.
🚧 Key Resistance Levels
The first major resistance lies around US$165–166, as many models flag this zone as R1.
Further resistance around US$175-180, especially if the price tries to break out of the current down-channel.
A more extended resistance area is ~US$182.99 and above, which would likely require strong bullish momentum.
Interpretation: Before SOL can resume a strong up-move, reclaiming and holding above ~US$165-175 would be a positive signal. Without that, upside may remain limited.
🧭 Possible Scenarios
Bullish case: If SOL holds near ~US$150 and manages to break above ~US$165-175 with decent volume, we could see a move toward the ~US$180+ zone. In that case, the downtrend channel could be invalidated and trend reversal might start.
Bearish case: If price breaks below ~US$150 convincingly, next support ~US$145 or lower ~US$131 could become targets. The down-channel remains intact in that scenario, and resistance remains stiff until ~US$175+.
✅ What to Watch
Volume & structure: A rebound on weak volume may fail. A breakout above ~US$165-175 with strong volume would be more meaningful.
Trend channel: Watch for price behaviour around the down-channel trendline. A breakout there would be a strong sign of reversal.
Macro / fundamental events: For crypto like Solana, network developments, unlock schedules, and institutional flows matter. For example, the recent token unlocks are cited as some of the selling pressure.
Support confirmation: Does the price bounce off ~US$150-153? A solid bounce suggests support is meaningful; a quick break suggests deeper weakness.
🔮 Summary
Solana (SOL) is currently in a cautious phase: the price broke key support near ~US$156, major resistance is still well above (~US$175-180), and the trend remains downward unless a breakout occurs.
For someone watching: holding above ~US$150 gives some hope; breakout above ~US$165-175 would sound more optimistic. Conversely, a drop below ~US$145 would increase risk of deeper correction.
If you like, I can pull up a live annotated chart with support/resistance zones mapped (for a particular timeframe – daily or 4-hour). Would you like me to do that?
#StrategyBTCPurchase #CryptoIn401k #GENIUSAct #PowellWatch #CryptoScamSurge