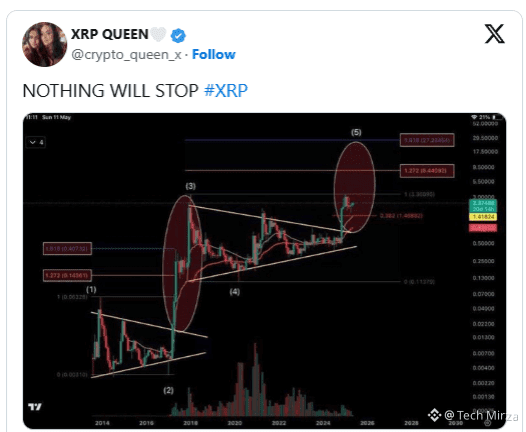
XRP Queen (@crypto_queen_x) has shared a long-term XRP chart spanning more than a decade, declaring that “nothing will stop XRP.” The chart highlights a recurring market structure that has repeated across multiple cycles: consolidation → breakout → expansion → correction.
Based on this structure, XRP appears to be midway through an expansion phase, suggesting the current uptrend is not yet complete.
A Repeating Long-Term Pattern
Historically, XRP has spent extended periods consolidating within symmetrical triangles, acting as accumulation zones before powerful upside moves. Each cycle followed a similar progression:
Sideways consolidation inside multi-year channels
A decisive breakout
A sharp expansion phase
A correction that held above rising trend support
Importantly, these rallies were not driven by single breakout events but developed over several years.
In the current cycle, XRP has already broken out of its most recent consolidation range. Between late 2024 and early 2025, the asset surged more than 500%, flipping long-term resistance into support. Failed breakouts typically return back into the range — but XRP has not. Instead, each pullback has formed higher lows, reinforcing the bullish structure.
Fibonacci Levels Point Higher
XRP Queen’s chart also applies Fibonacci extensions to prior expansion waves. In previous cycles, XRP topped near the 1.272 and 1.618 extensions, marking the final stages of each rally rather than early resistance.
Those same levels now project far above current price:
1.272 extension: ~$8.44
1.618 extension: ~$27.23
Notably, multiple analysts independently identify the $27 area as a long-term target.
XRP has already reclaimed the 0.382 retracement near $1.47, a level that historically acted as a key dividing line. In past cycles, holding above it led to further upside, while losing it triggered deeper corrections. Recent pullbacks in late 2025 respected this level, keeping the bullish structure intact.
Outlook
As long as XRP holds above rising trend support and key retracement levels, the long-term pattern remains valid. According to the chart, this cycle is still unfolding, and the expansion phase has yet to reach its historical peak.